Extremely slow "Connect n transactions" / "Connect block" #21095

issue C-Otto opened this issue on February 6, 2021
  1. C-Otto commented at 4:31 PM on February 6, 2021: none

    I'm running Bitcoin Core 0.21.0. I'm having severe performance issues, and I'm in the process of debugging this. With debug=1 I see the snippet shown below, with one notable line:

    Connect 3053 transactions: 788138.97ms (258.152ms/tx, 143.038ms/txin) [788.14s (788138.97ms/blk)]

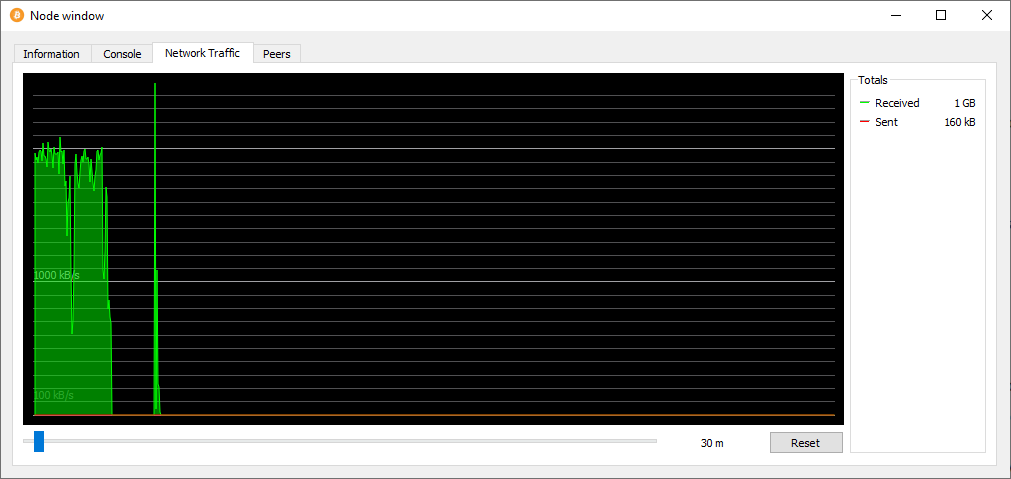
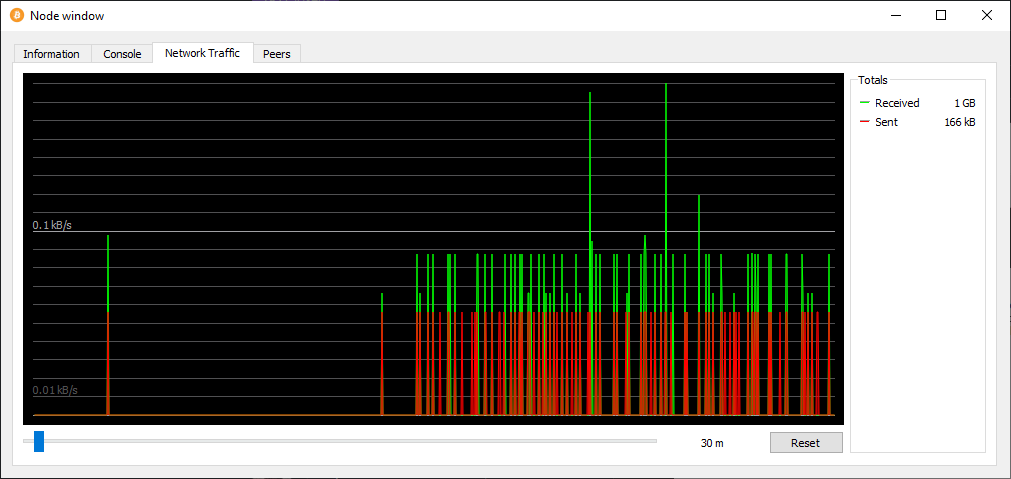
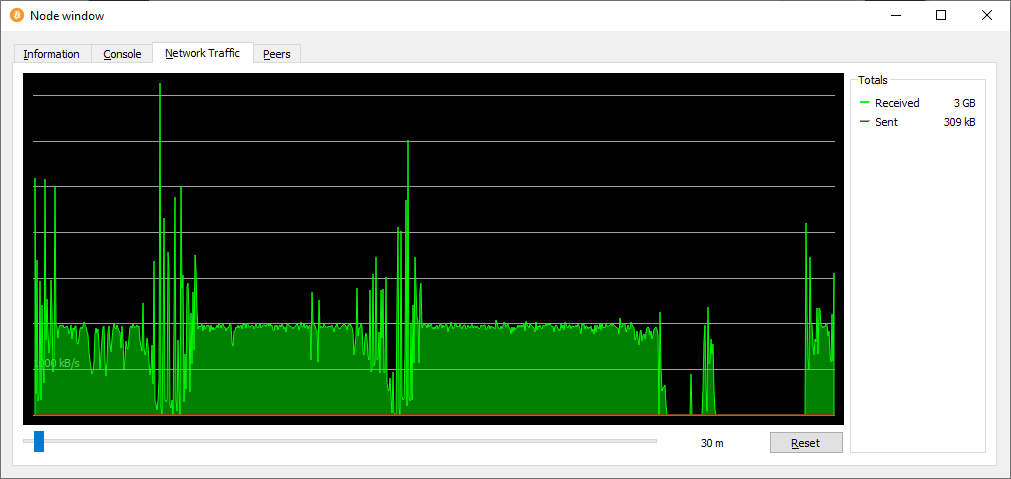
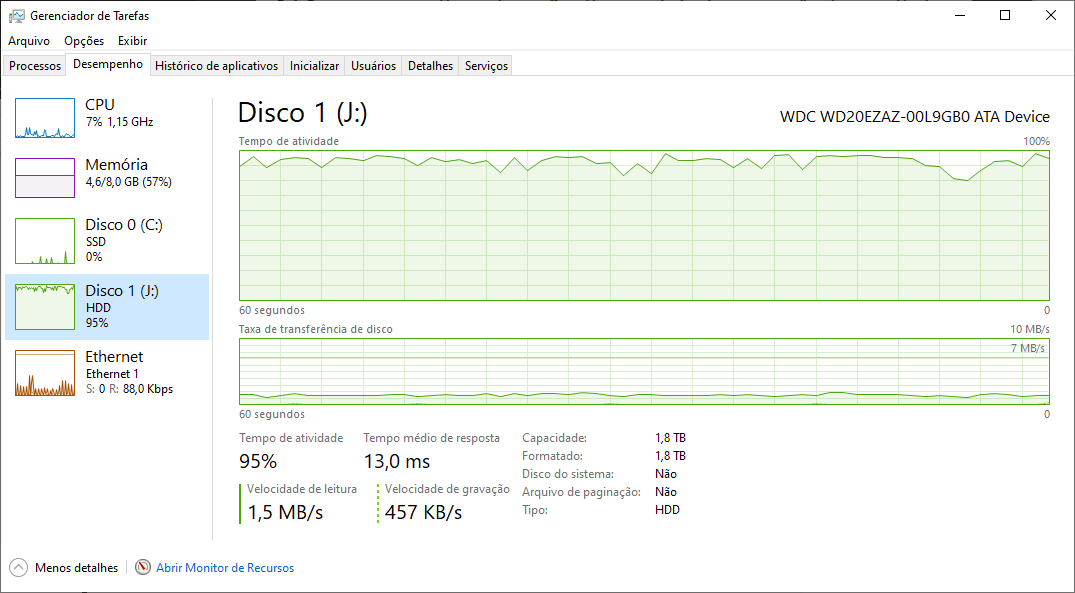
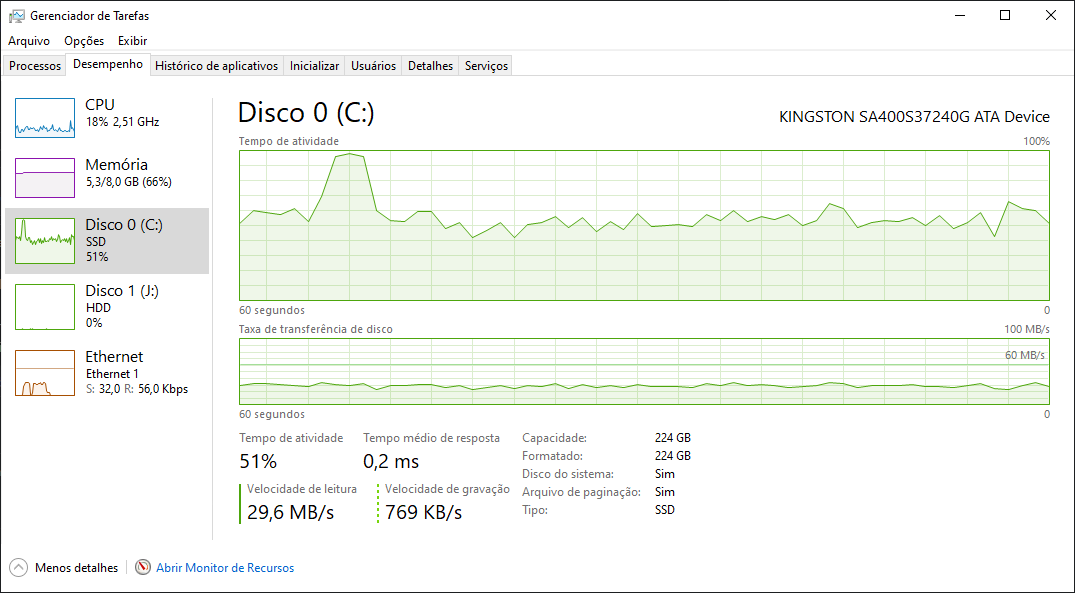
    The machine has 10 Xeon cores, 128 GByte RAM, and a disk backend that is fast enough to serve data at multi-gigabit speed. I fail to understand why processing a single block is so extremely slow, and I'd appreciate any information you might have.

    Which files are accessed for this? What kind of access pattern is used? Can I get further debug information?

    This happened after a restart. My config has checklevel=1, dbcache=8000 and maxmempool=1024.

    2021-02-06T16:09:28Z   - Load block from disk: 20.50ms [0.02s]
    2021-02-06T16:09:28Z     - Sanity checks: 2.12ms [0.00s (2.12ms/blk)]
    2021-02-06T16:09:28Z     - Fork checks: 1.54ms [0.00s (1.54ms/blk)]
    2021-02-06T16:22:36Z       - Connect 3053 transactions: 788138.97ms (258.152ms/tx, 143.038ms/txin) [788.14s (788138.97ms/blk)]
    2021-02-06T16:22:36Z     - Verify 5510 txins: 788139.47ms (143.038ms/txin) [788.14s (788139.47ms/blk)]
    2021-02-06T16:22:36Z     - Index writing: 0.04ms [0.00s (0.04ms/blk)]
    2021-02-06T16:22:36Z     - Callbacks: 0.01ms [0.00s (0.01ms/blk)]
    2021-02-06T16:22:36Z BlockChecked: block hash=00000000000000000007a985c631c541c05fe7d953c7be8cda1895c4bb5b8ddf state=Valid
    2021-02-06T16:22:36Z   - Connect total: 788143.91ms [788.14s (788143.91ms/blk)]
    2021-02-06T16:22:36Z   - Flush: 8.38ms [0.01s (8.38ms/blk)]
    2021-02-06T16:22:36Z   - Writing chainstate: 0.05ms [0.00s (0.05ms/blk)]
    2021-02-06T16:22:36Z Blockpolicy estimates updated by 0 of 0 block txs, since last block 0 of 0 tracked, mempool map size 0, max target 1008 from historical
    2021-02-06T16:22:36Z UpdateTip: new best=00000000000000000007a985c631c541c05fe7d953c7be8cda1895c4bb5b8ddf height=669370 version=0x2dcc0000 log2_work=92.647517 tx=613502147 date='2021-02-06T11:26:13Z' progress=0.999898 cache=2.1MiB(15563txo)
    2021-02-06T16:22:36Z   - Connect postprocess: 13.99ms [0.01s (13.99ms/blk)]
    2021-02-06T16:22:36Z - Connect block: 788186.84ms [788.19s (788186.84ms/blk)]
    2021-02-06T16:22:36Z Enqueuing BlockConnected: block hash=00000000000000000007a985c631c541c05fe7d953c7be8cda1895c4bb5b8ddf block height=669370
    2021-02-06T16:22:36Z Enqueuing UpdatedBlockTip: new block hash=00000000000000000007a985c631c541c05fe7d953c7be8cda1895c4bb5b8ddf fork block hash=000000000000000000018b3b66d231614b0d056bea2f4572f9cba2984e2e01d7 (in IBD=true)
    2021-02-06T16:22:37Z   - Load block from disk: 796.62ms [0.82s]
    2021-02-06T16:22:37Z     - Sanity checks: 2.48ms [0.00s (2.30ms/blk)]
    2021-02-06T16:22:37Z     - Fork checks: 0.07ms [0.00s (0.80ms/blk)]
    

    EDIT: Next blocks:

    2021-02-06T16:46:39Z       - Connect 2465 transactions: 1442078.16ms (585.022ms/tx, 209.879ms/txin) [2230.22s (1115108.56ms/blk)]
    2021-02-06T16:59:35Z       - Connect 2564 transactions: 775256.86ms (302.362ms/tx, 129.924ms/txin) [3005.47s (1001824.66ms/blk)]
    2021-02-06T17:24:20Z       - Connect 1788 transactions: 1485121.29ms (830.605ms/tx, 208.321ms/txin) [4490.60s (1122648.82ms/blk)]
    
  2. C-Otto added the label Bug on Feb 6, 2021
  3. wpeckr commented at 5:06 PM on February 6, 2021: none

    What does the storage backend of the server look like?

    logtimemicros=1 wouldn't hurt debugging, but also won't help anything here.

    checklevel=1 has no impact on operating performance, it is only applied to blocks being re-verified on startup.

  4. C-Otto commented at 5:08 PM on February 6, 2021: none

    The storage backend is a 8x 6 TByte HDD array with 2x 480 GByte SSDs, configured using ZFS:

                                                       capacity     operations     bandwidth 
    pool                                             alloc   free   read  write   read  write
    -----------------------------------------------  -----  -----  -----  -----  -----  -----
    tank                                             36.9T  6.82T  1.27K    978   120M  19.4M
      raidz1                                         36.9T  6.80T  1.22K    133   119M  14.2M
        wwn-0x5000c50089db7237                           -      -    159     16  15.0M  1.77M
        scsi-35000c50089dbd36f                           -      -    157     16  14.8M  1.76M
        scsi-35000c5008969860b                           -      -    159     16  15.0M  1.77M
        scsi-35000c50089de0367                           -      -    158     16  14.8M  1.76M
        scsi-35000c50089de38ff                           -      -    156     16  15.0M  1.77M
        scsi-35000c500898451a7                           -      -    152     16  14.8M  1.77M
        scsi-35000c50089dde8af                           -      -    151     16  15.0M  1.77M
        scsi-35000c50089969867                           -      -    158     16  14.8M  1.76M
    special                                              -      -      -      -      -      -
      mirror                                         77.9G  21.6G     48    841   397K  5.04M
        ata-SSDSC2KB480G8R_PHYF001200CA480BGN-part2      -      -     24    420   198K  2.52M
        ata-SSDSC2KB480G8R_PHYF00110AH9480BGN-part2      -      -     24    420   198K  2.52M
    logs                                                 -      -      -      -      -      -
      mirror                                         4.07M  1.87G      0      4      3   249K
        wwn-0x55cd2e4152123f7b-part1                     -      -      0      2      1   124K
        wwn-0x55cd2e415212417d-part1                     -      -      0      2      1   124K
    cache                                                -      -      -      -      -      -
      ata-SSDSC2KB480G8R_PHYF001200CA480BGN-part3     311G  34.1G    672     13  55.9M  3.20M
      ata-SSDSC2KB480G8R_PHYF00110AH9480BGN-part3     311G  34.5G    673     13  55.9M  3.20M
    

    Recordsize is 1M, compression lz4. Detailed performance statistics:

  5. wpeckr commented at 5:22 PM on February 6, 2021: none

    I have a suspicion that somehow the combination of compression and the large record size is optimally poor for cold reads from leveldb, but someone with a bit more knowledge can probably say something more concrete. I have noticed extremely poor performance on a similarly configured system that had lzjb ZFS compression enabled, but nowhere near as terrible as you're seeing (30 seconds, not 20 minutes).

  6. C-Otto commented at 5:24 PM on February 6, 2021: none

    I could change any of that, per directory. I have no idea which files are read at the moment (see above), so I'm a bit lost. I picked the recordsize because of the large files that store the actual blocks, but this might be an issue for other files. As far as I know compression is just adding some CPU load, which shouldn't be an issue here.

  7. C-Otto commented at 5:25 PM on February 6, 2021: none

    Could I delete some files and download the data from other peers (without re-downloading the whole chain)? I have plenty of network speed (20 GBit/sec), especially compared to how fast the disk backend is.

  8. wpeckr commented at 5:32 PM on February 6, 2021: none

    Block files are an append only store, with chunks of various sizes just being appended to 128MB files. They are not performance critical and are not referenced by any validation code once written. The main critical part for disk performance are the files in chainstate/, the UTXO storage in LevelDB format, which is only a couple of gigabytes or so.


    You can force the node to reprocess blocks at the tip of the chain using invalidateblock and reconsiderblock, but this won't necessarily emulate the same performance concerns you're seeing now. Deleting any of the nodes files will just result in corruption, there's nothing that will be re-downloaded on failure.

    bitcoin-cli invalidateblock 0000000000000000000a5f06f29103ad04feb7fa8204ae64112b096f9d9bcf6c

    (a lot of time passes while blocks are being undone)

    bitcoin-cli reconsiderblock 0000000000000000000a5f06f29103ad04feb7fa8204ae64112b096f9d9bcf6c

  9. C-Otto commented at 5:39 PM on February 6, 2021: none

    OK, moving chainstate/ to a ZFS file system with recordsize=4k, special_small_blocks=4k, and compression=off. Let's see.

  10. C-Otto commented at 7:22 PM on February 6, 2021: none

    That didn't help, but I moved chainstate to an Ext4 on SSDs:

    2021-02-06T19:16:59Z       - Connect 2751 transactions: 1706.08ms (0.620ms/tx, 0.272ms/txin) [13.36s (2672.72ms/blk)]
    

    Lesson learned: Put chainstate/ on a fask disk.

  11. C-Otto closed this on Feb 6, 2021

  12. sipa commented at 7:33 PM on February 6, 2021: member

    Lesson learned: Put chainstate/ on a fask disk.

    Yes, it's an I/O-heavy database, you want low latency more than high bandwidth.

    You can also compensate somewhat by using a larger -dbcache FWIW.

  13. tadeubas commented at 12:08 AM on March 8, 2022: none

    I had to comment to thank @C-Otto for this issue and his solution to slow sync with blockchain. I have a 16MB speed connection but the download speed never stayed high, instead it suddenly dropped to almost zero and stayed at that level for all day, the GUI showed that the sync with the blockchain would complete in 20+ weeks!

    After moving the ~3GB chainstate/ folder to my SSD (mklink /J, a junction in windows), now the download speed is at the limit almost all the time and the GUI tells that the sync will end in a matter of 2 days!

    Bitcoincore Node window > Network Traffic BEFORE moving chainstate/: bitcoincore nodewindow network traffic2 bitcoincore nodewindow network traffic3

    Bitcoincore Node window > Network Traffic AFTER moving chainstate/: nodewindow-after


    Disk usage from Windows Task Manager BEFORE moving chainstate/: hdd usage windows

    Disk usage from Windows Task Manager AFTER moving chainstate/: hddusageafter


    Ethernet usage from Windows Task Manager BEFORE moving chainstate/: ethernet usage windows

    Ethernet usage from Windows Task Manager AFTER moving chainstate/: ethernet-after

    PS: It is worth noting that my WD20EZAZ 2TB HDD uses Shingled Magnetic Recording (SMR), this made everything worse and created the disk I/O bottleneck.

  14. DrahtBot locked this on Mar 8, 2023
Labels

github-metadata-mirror

This is a metadata mirror of the GitHub repository bitcoin/bitcoin. This site is not affiliated with GitHub. Content is generated from a GitHub metadata backup.
generated: 2026-05-02 15:14 UTC

This site is hosted by @0xB10C
More mirrored repositories can be found on mirror.b10c.me