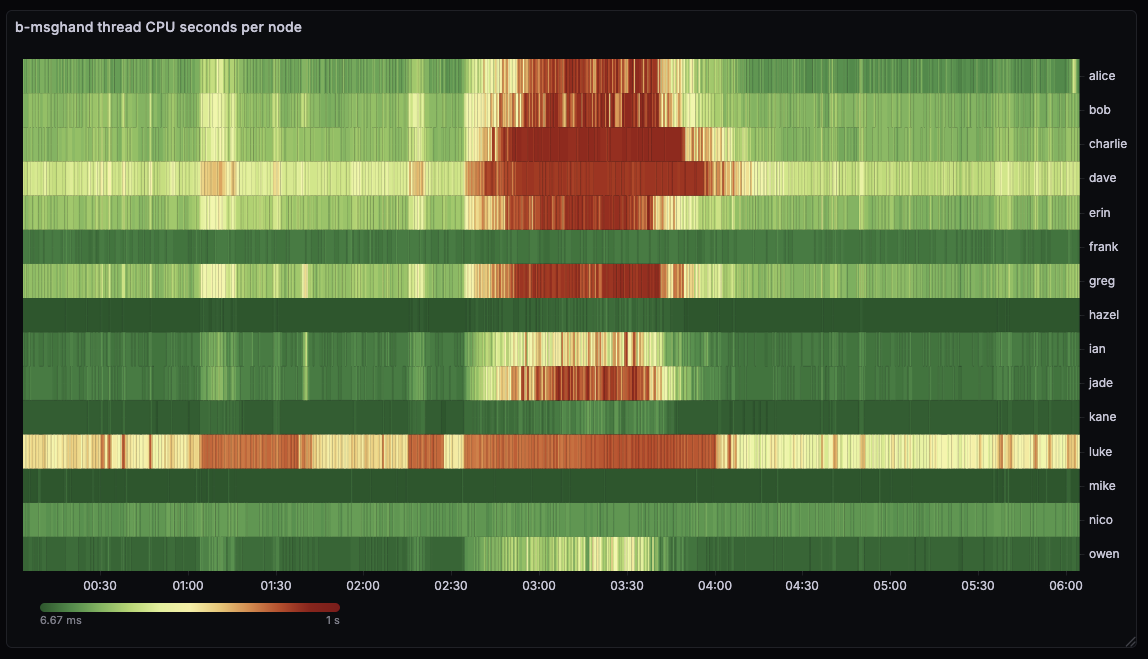
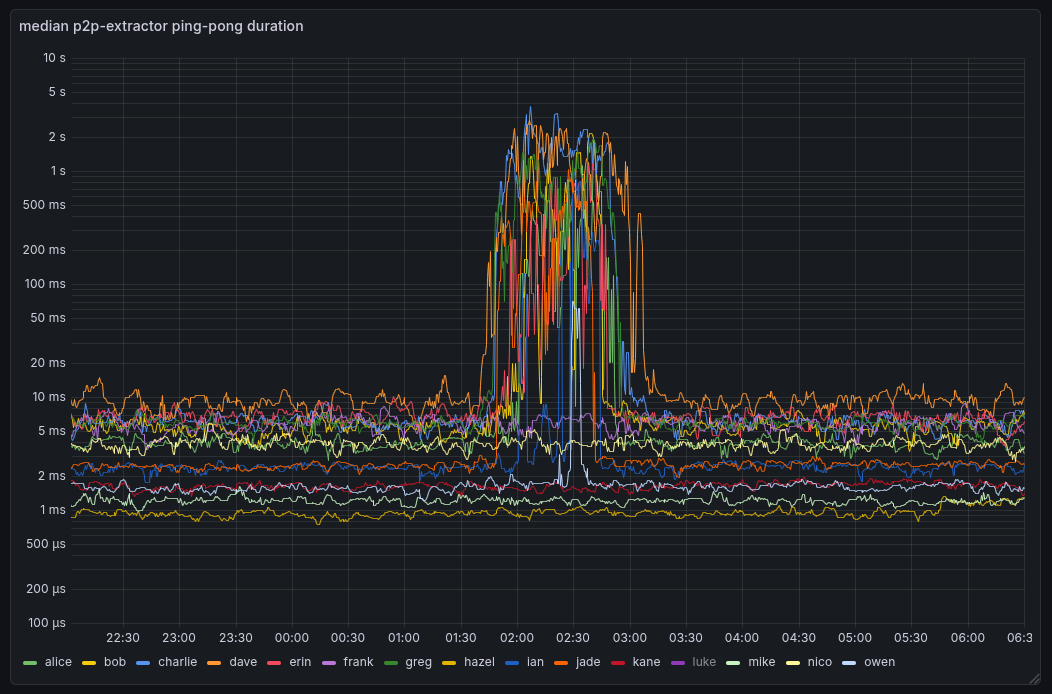
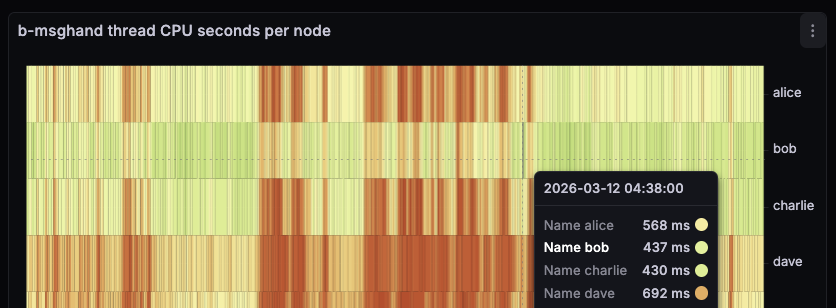
I noticed my peer-observer nodes spending a lot of time in b-msghand thread today on 2026-02-17 starting around 1:30 am UTC. Note that the screenshots are UTC+1.
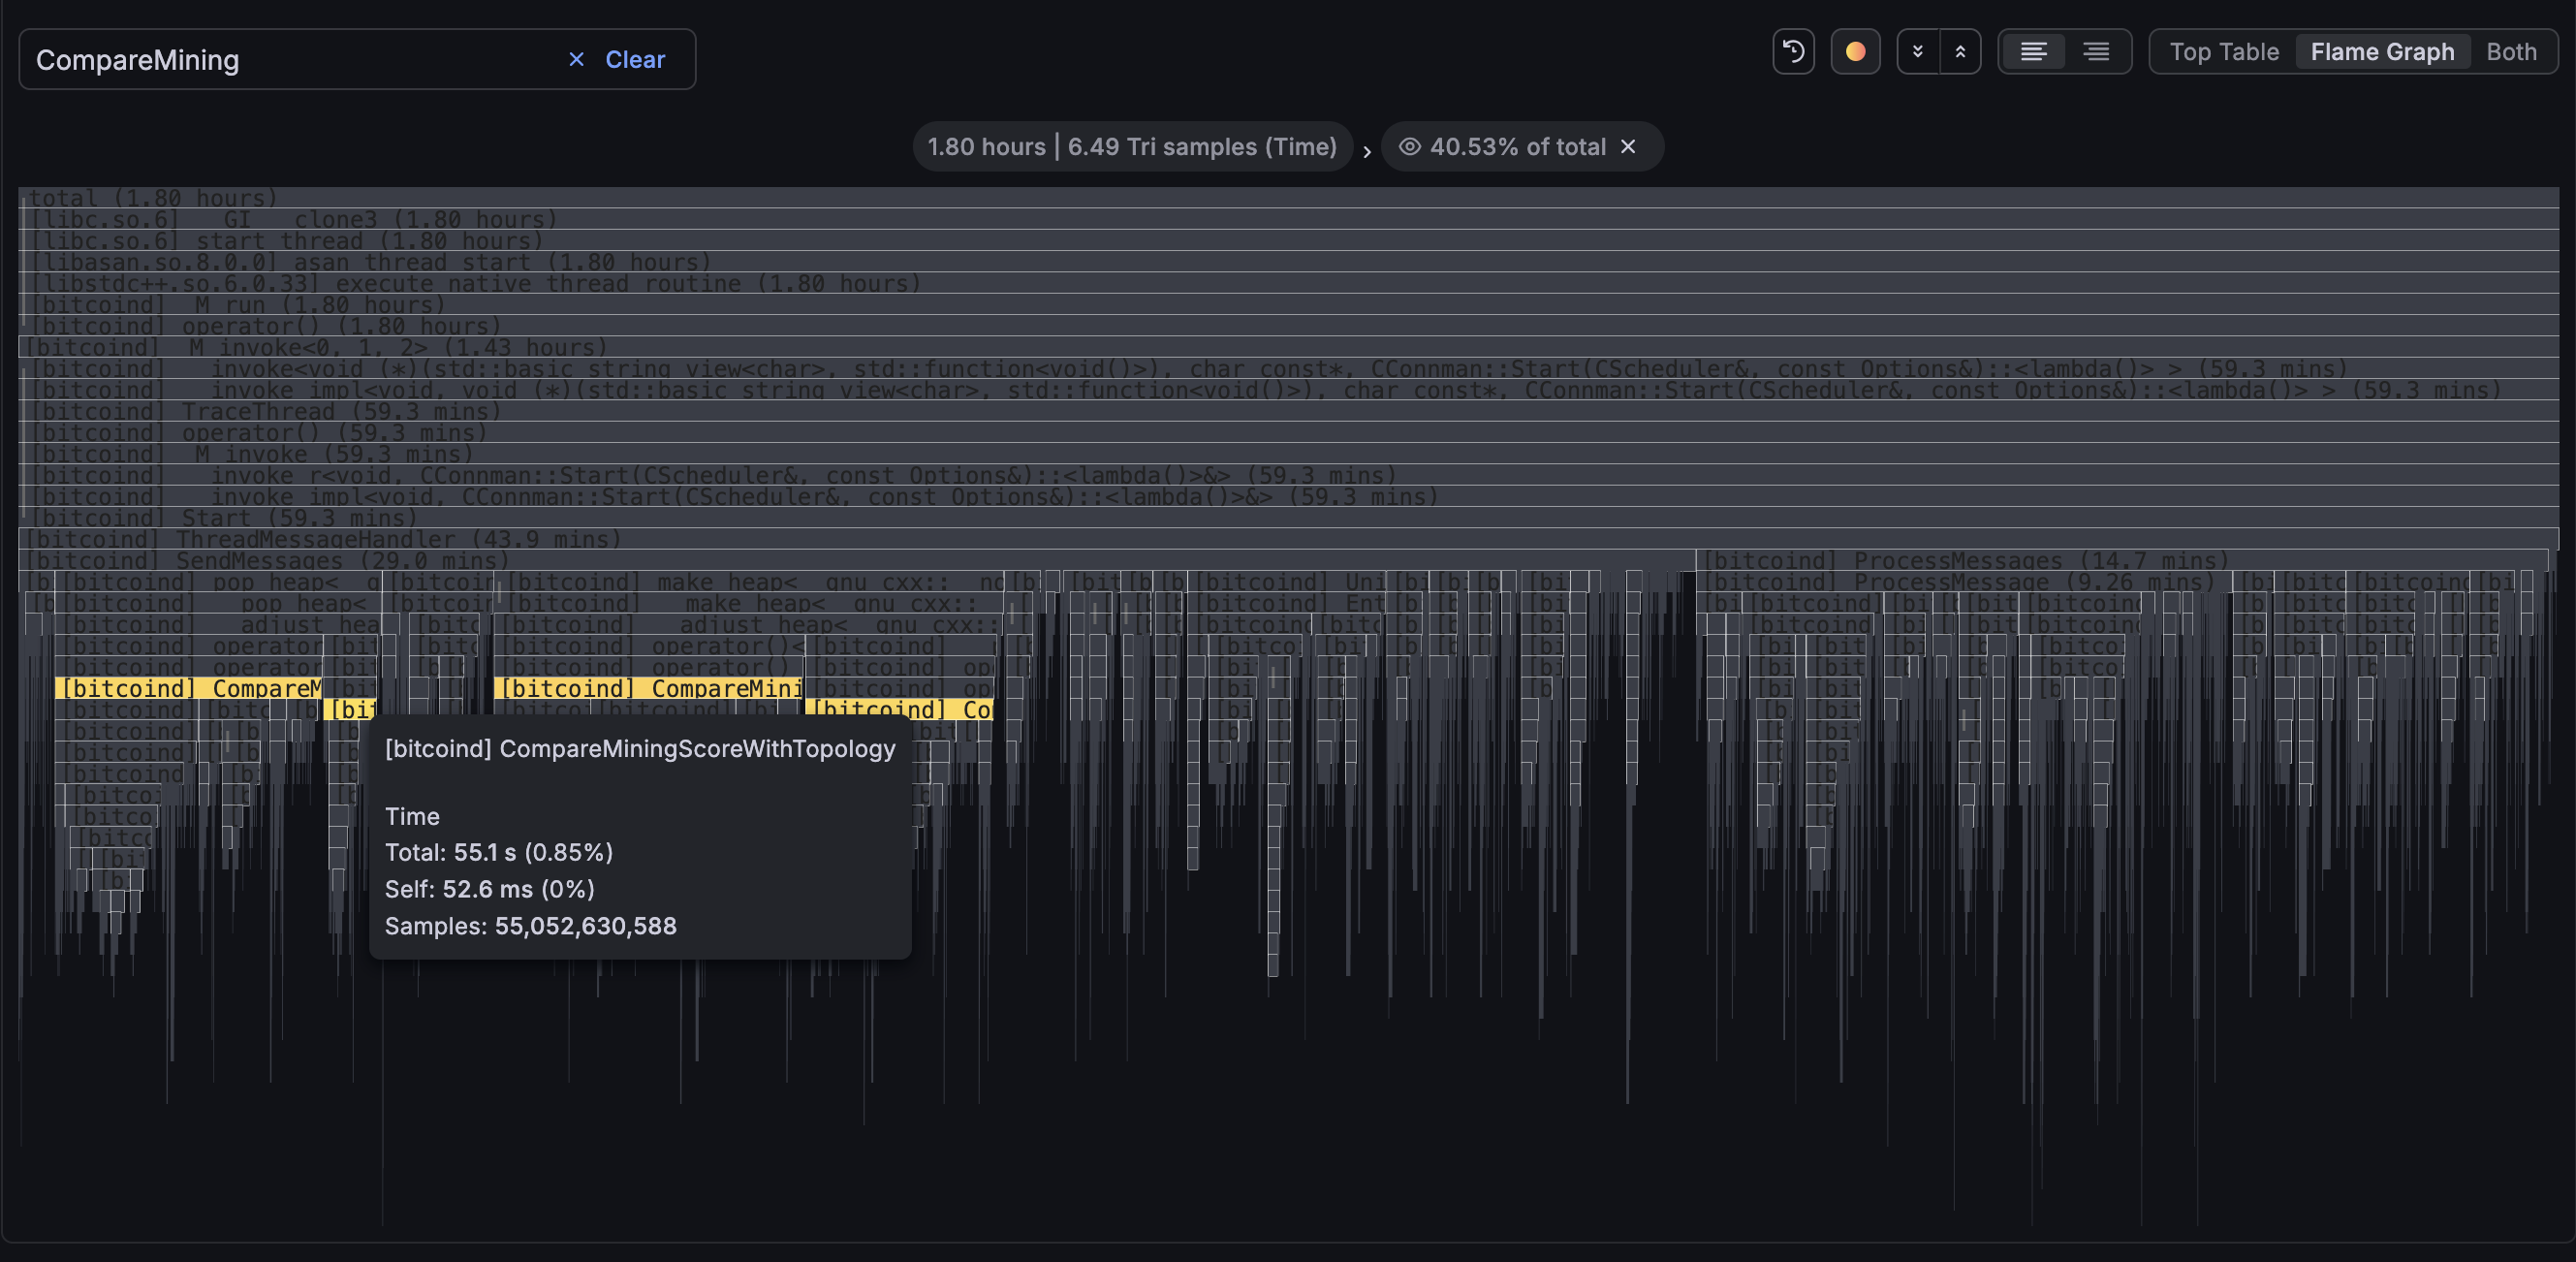
Looking on a different node at the broadcast at around 17:20 UTC shows that we spend about 20% of our time in CompareMiningScoreWithTopology() (i.e. the new name of CompareDepthAndScore).
Sorting before sending ensures that you’re not leaking info about the order in which you received the txs by the order in which you announce them.
I think have a global queue for rate limiting outbound announcements is the solution here, fwiw. Here’s a gist:
I’ve been running that code with a very low rate limit for inbounds (4tx/s instead of the 14tx/s target from core) to ensure it behaves well when backlogs occur, and it seems to.
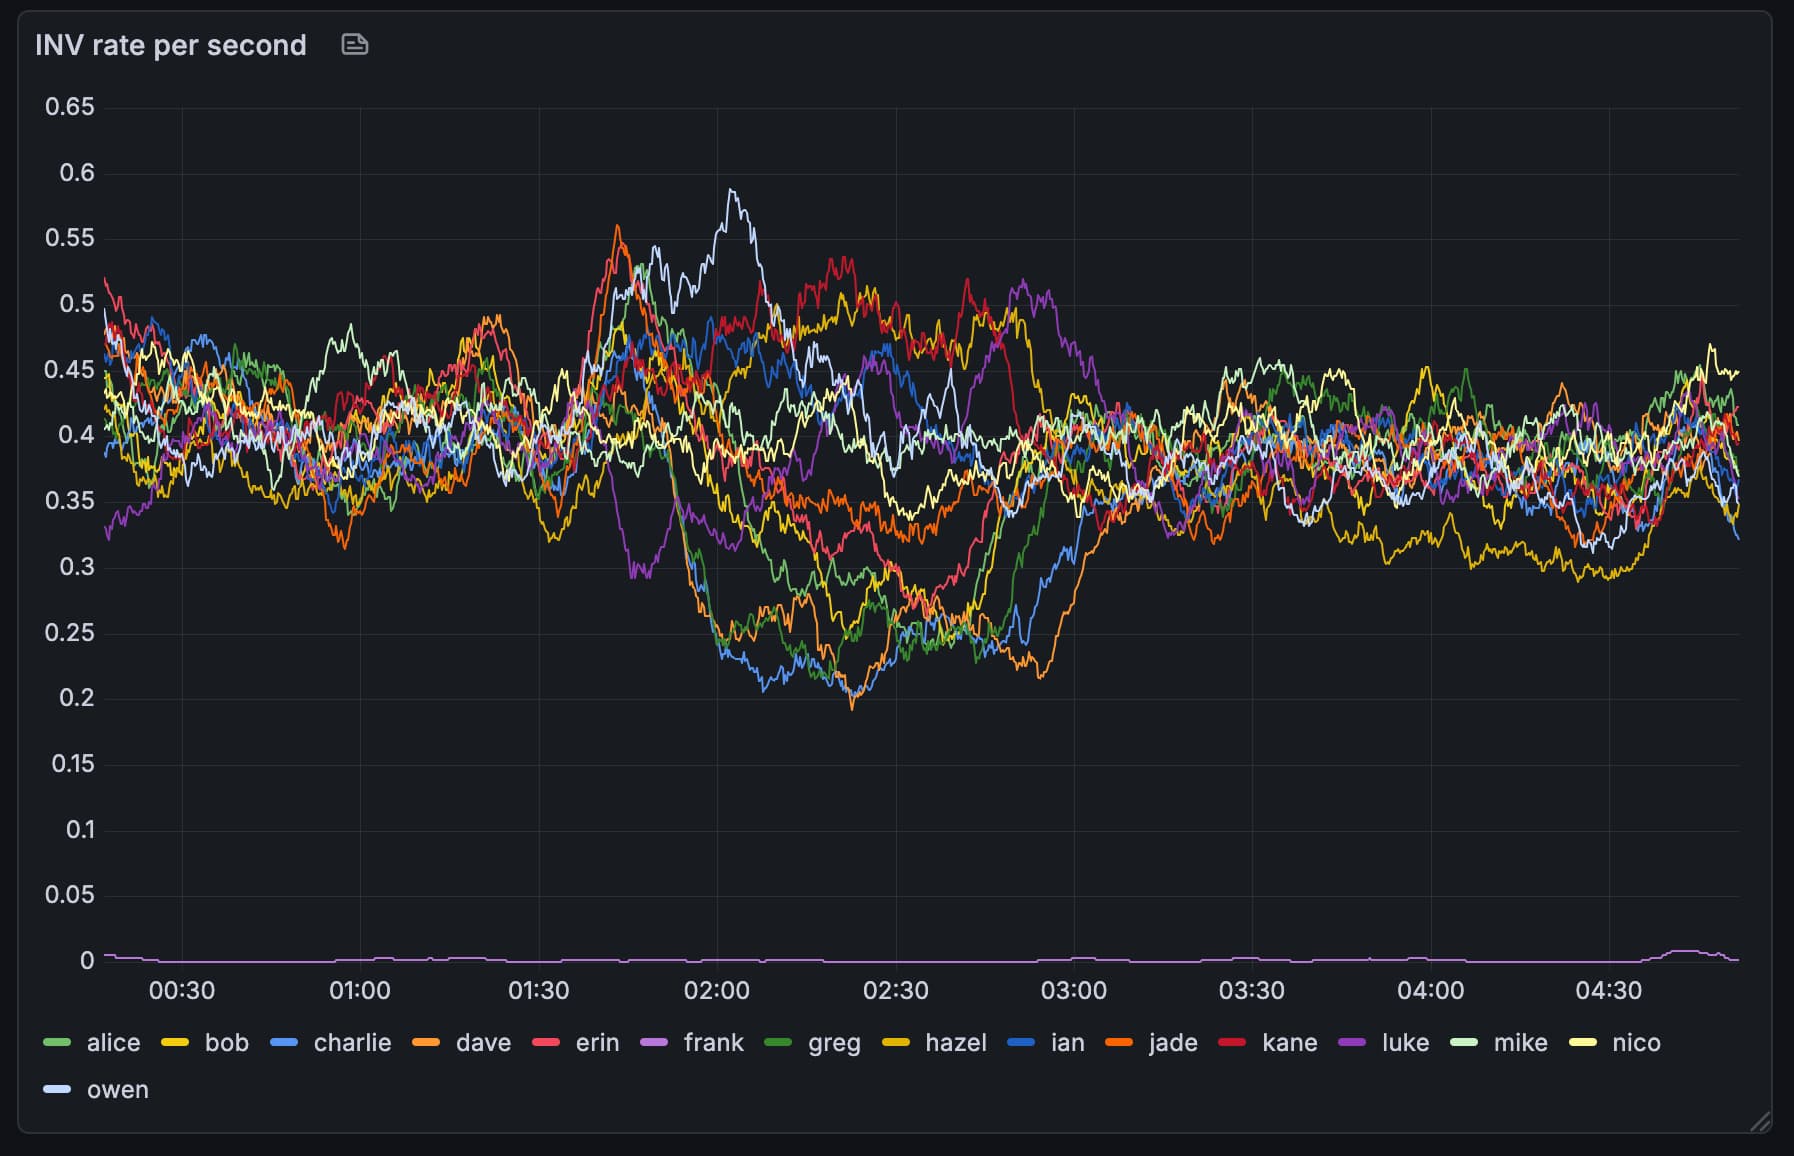
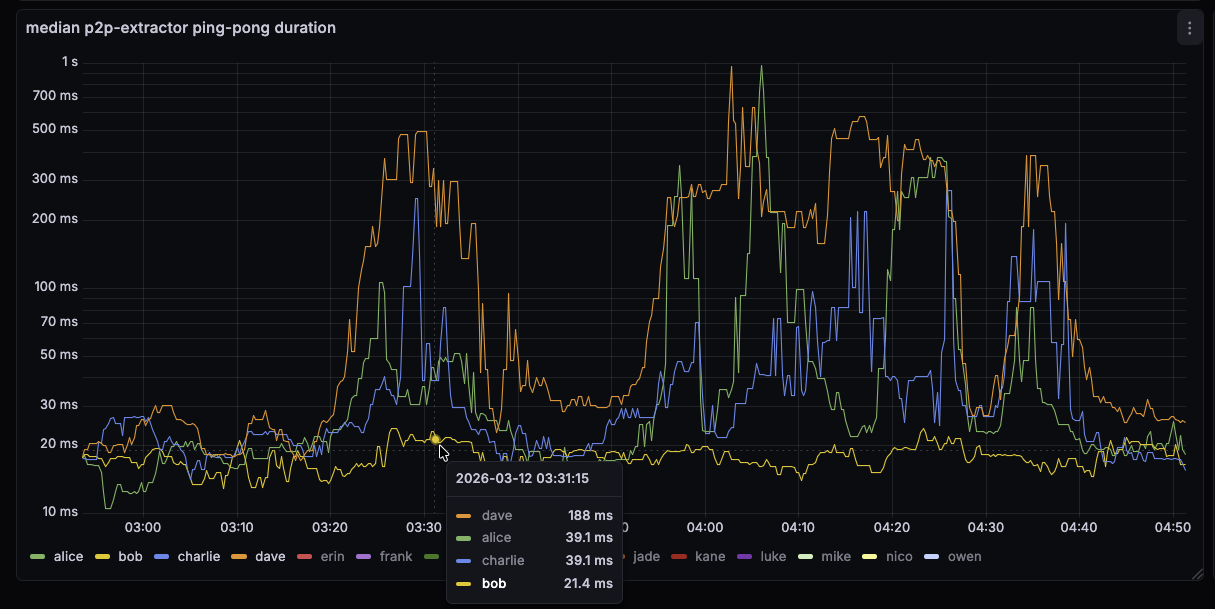
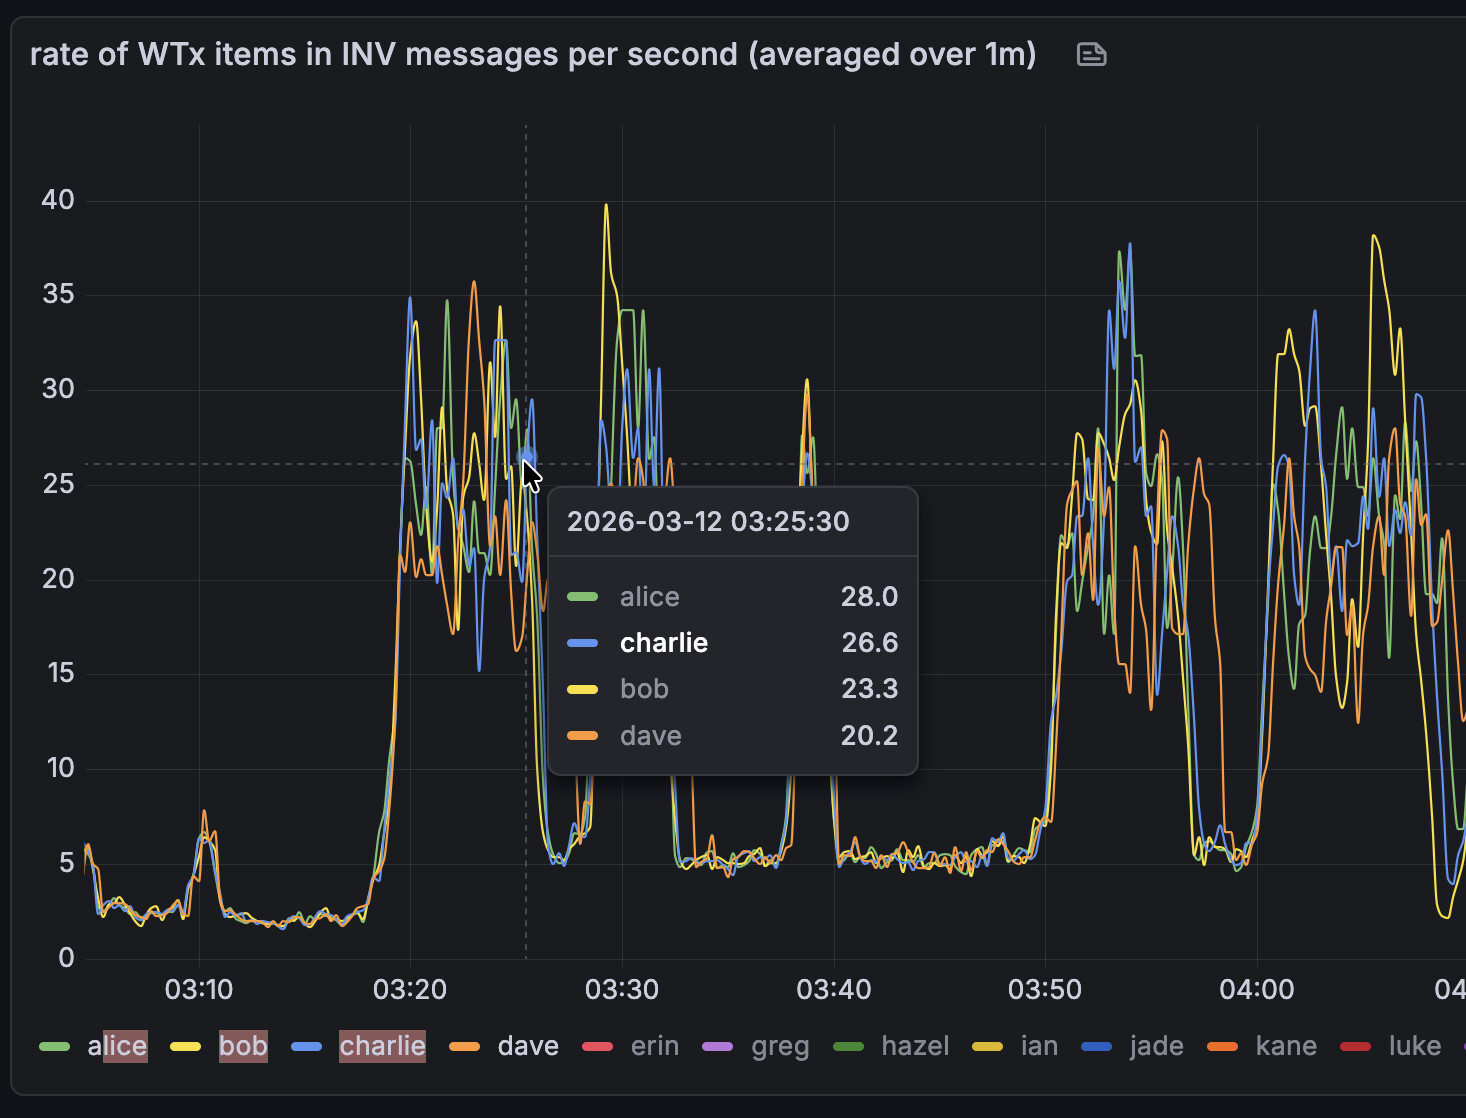
And here is the rate at which my local spy-node-like peer received WTx invs.
Normally, one would expect the rate at which we send INVs to remain fairly constant since we’re on a fixed timer. However, it seems like for some nodes it actually slowed INV-sending down by about 50% while for others it (at least briefly) speed up. My theory for slowing down is: the node is overloaded to a point where it can’t send out INVs at a normal rate.
Sure. I think I wasn’t clear in my description: Don’t keep a set (as we do currently), but keep a (sorted) queue. When inserting a to-be-announced transaction, put it in the right place in the queue. This avoids having to re-sort the whole set every 5s (or 2s for outbounds) for each peer. The queue is already sorted, so we can just pick the top 70 + x transactions to INV. Then, do some clean up removing evicted/confirmed transactions by iterating the queue once.
Maybe that’s similar to you gloabl queue. I’ll have a look.
As far as data structures go, a sorted queue is best stored as a set anyway; problem is that with cluster mempool the sort order doesn’t stay consistent as txs are added – a cpfp tx can bump the ordering of the pre-existing parent, eg. That breaks set invariants, so risks UB if using std::set, and I couldn’t see a simpler way of dealing with it properly without just doing a re-sort.
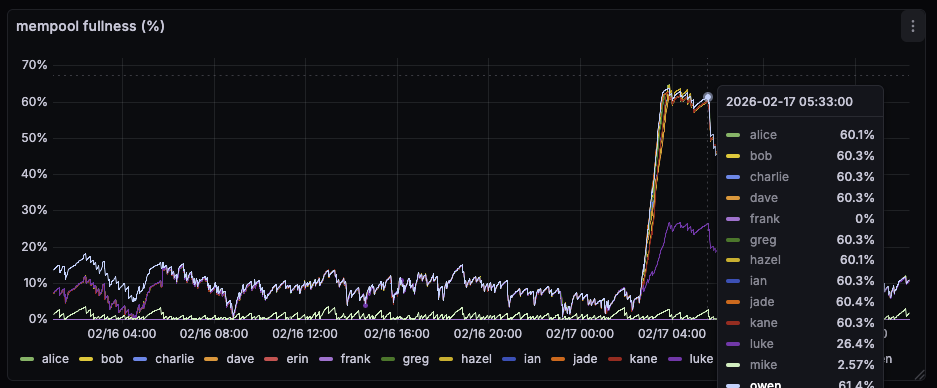
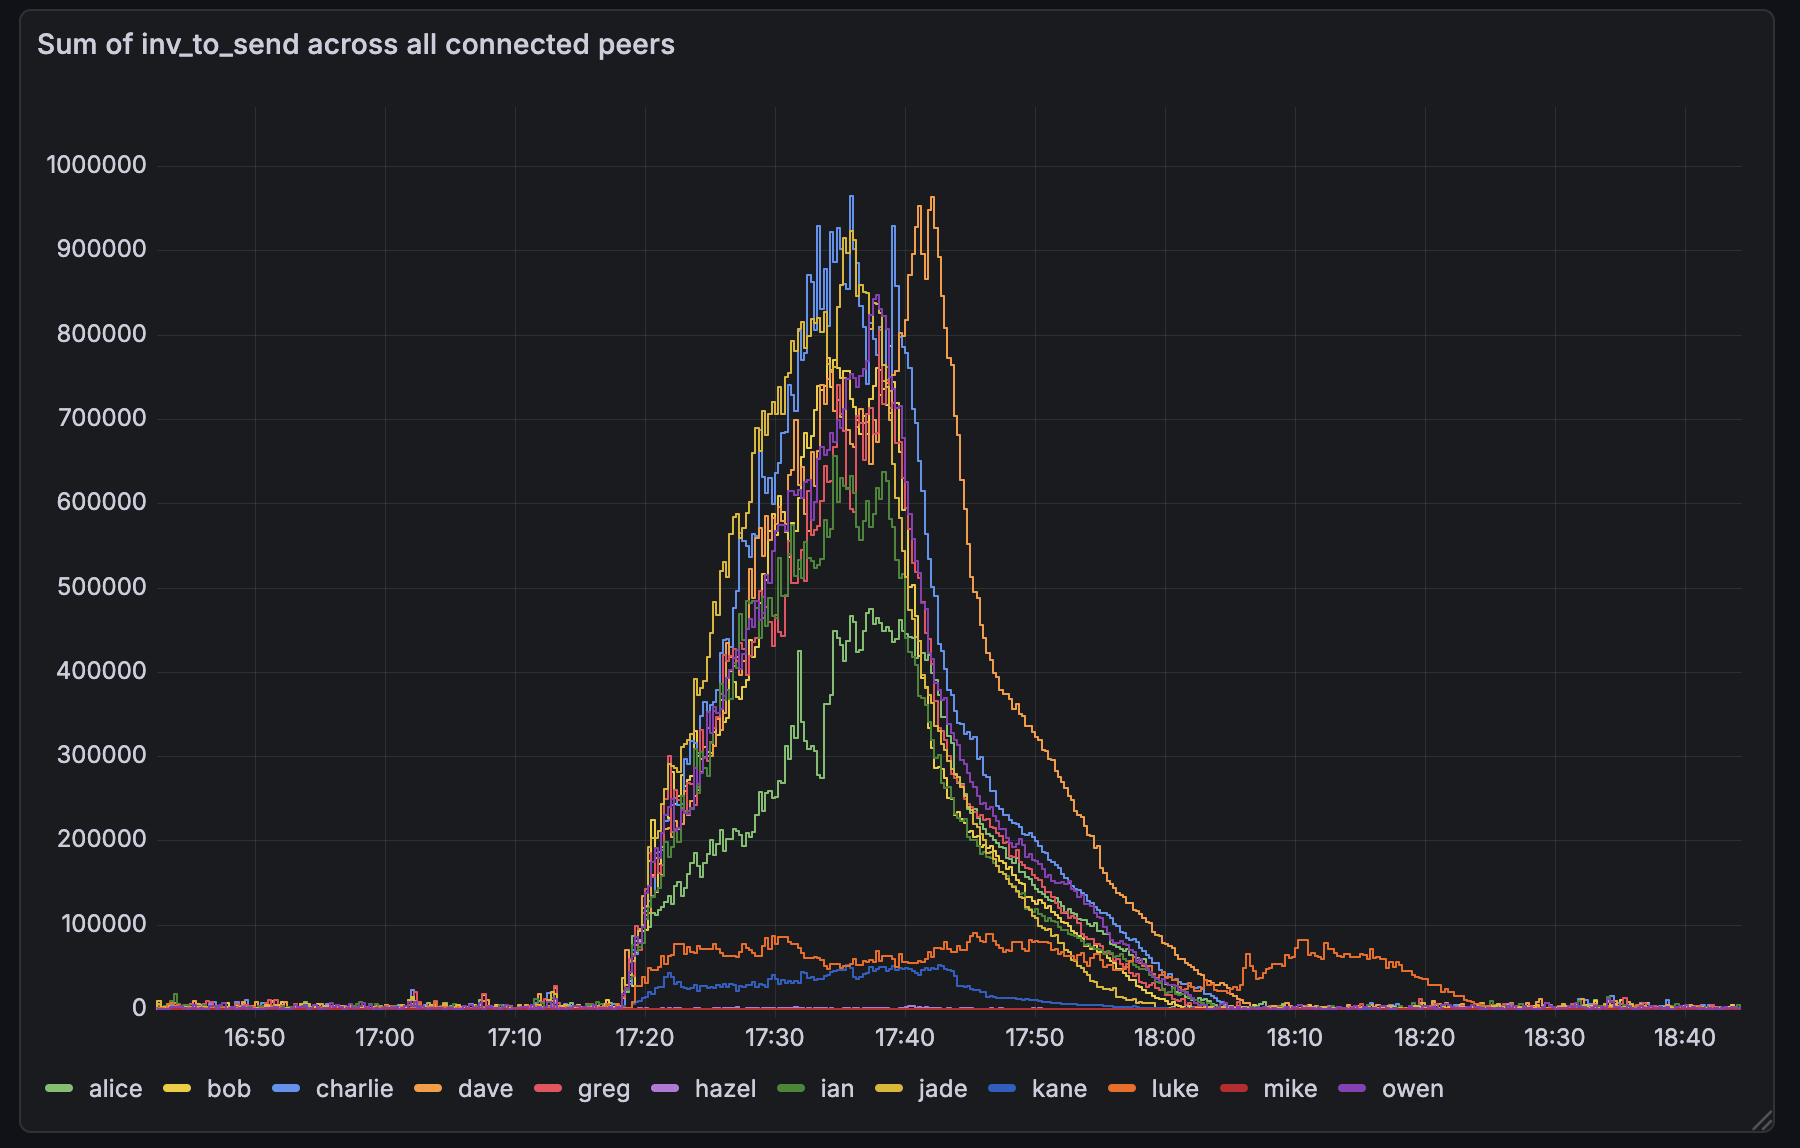
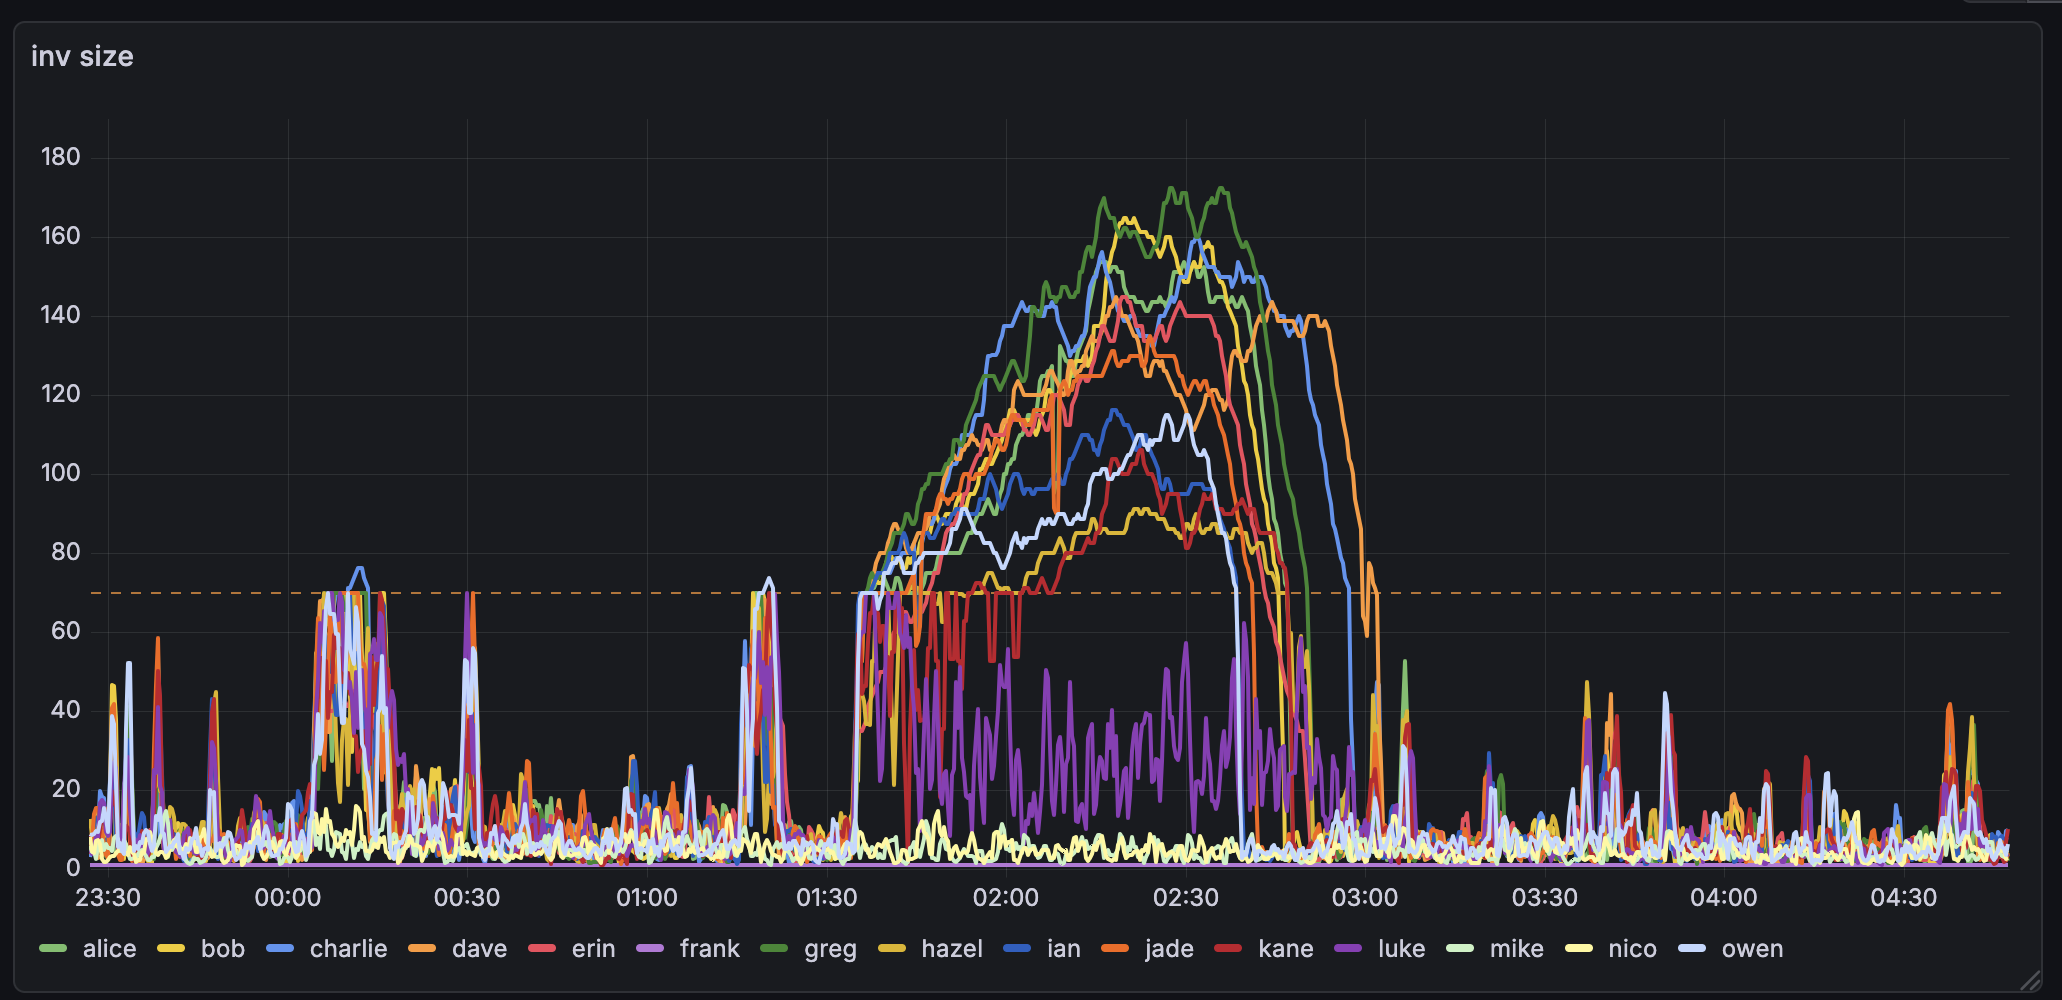
There seems to have been a small mass-broadcast event a few hours ago. Here are some observations:
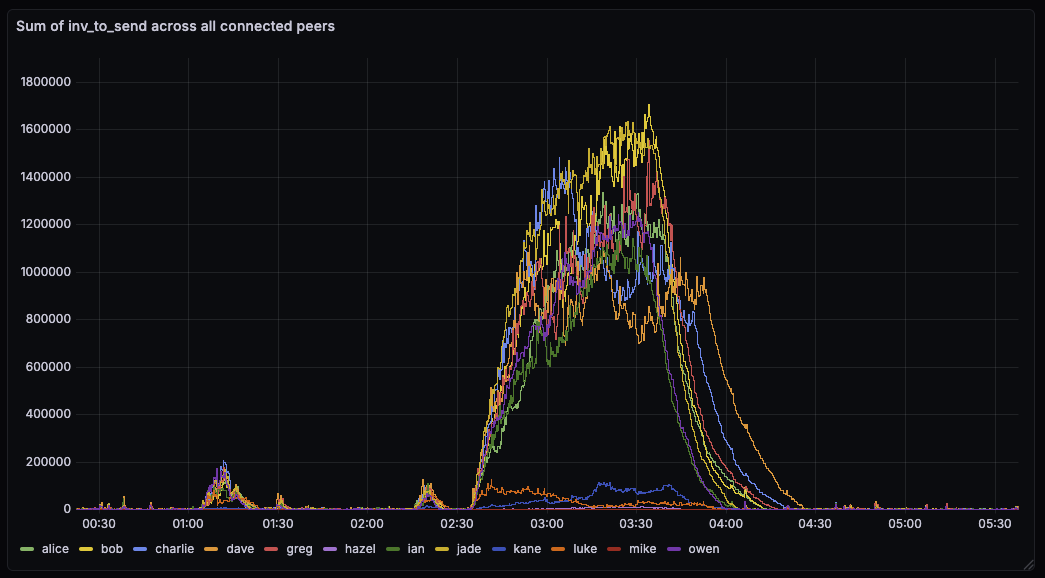
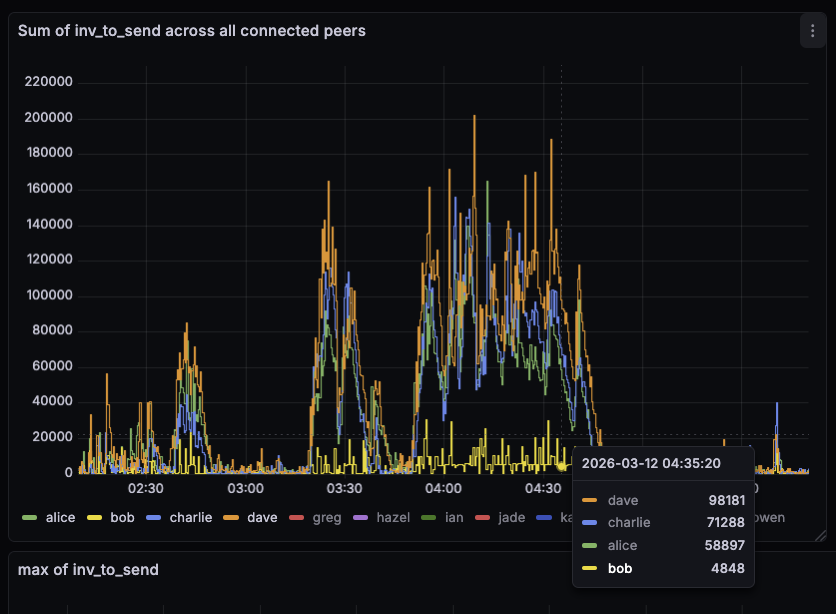
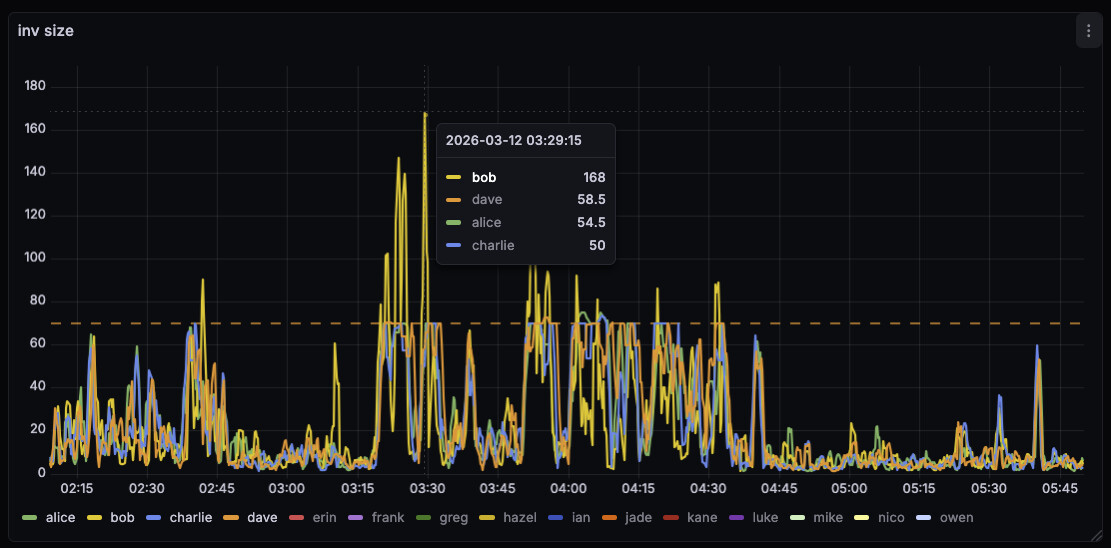
On bob, running #34628 with default txsendrate, the inv-to-send queues stayed a lot smaller. This is expected as we drain the per-peer queue immediately with 34628.
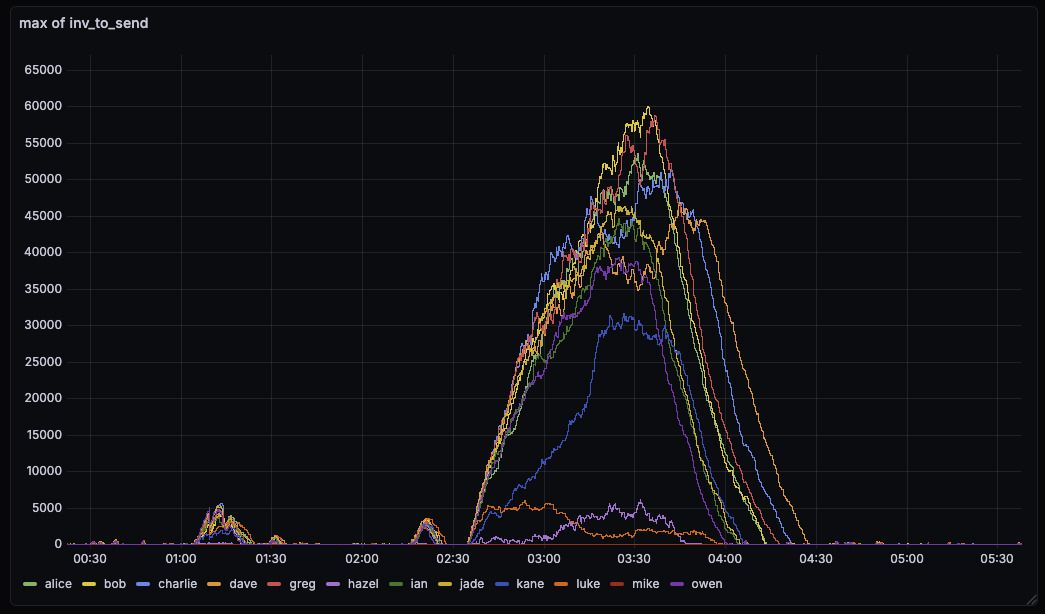
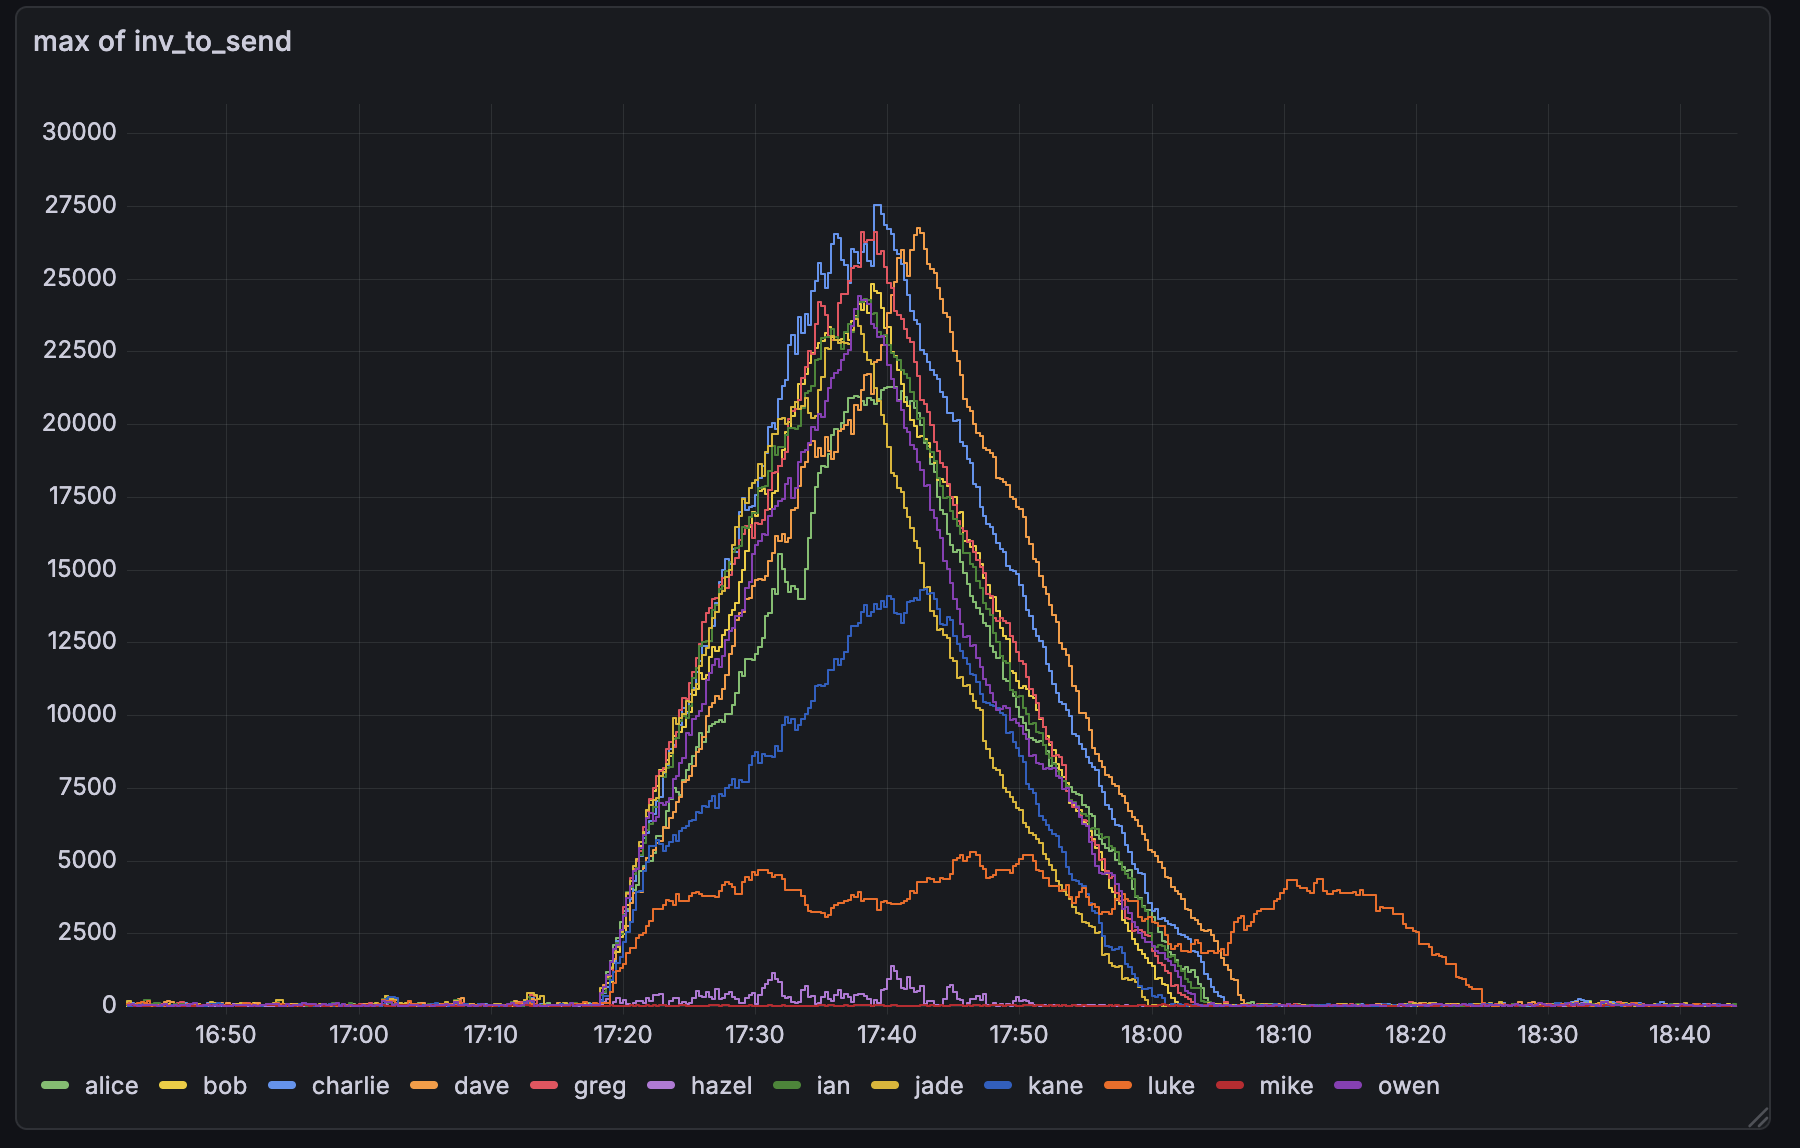
The INVs sent by bob were larger than the ones by the other nodes. With 34628, we fully drain the per-peer queue, so INVs can be larger than before, were we capped it at 70 (unless the queue got large).
Double-size INVs might not be verymeaningful – when there’s a backlog with #34628 the timing can be out of sync, acting like “send-inv, send-inv, populate-inv-queue, populate-inv-queue, send-inv”, so that the second send-inv is empty, and the third send-inv has to tranches of txs. Because populate-inv-queue targets a particular tx rate, send-inv over time should still average to the same 70tx-per-send-inv rate, even though individual send-inv’s can be two (or more) times that.
Are you able to do a rolling-average over 30s or 60s for that graph by any chance? I think that should bring the outgoing inv rates in line with each other.
I have “number of WTx entries send per second, averaged over 60s”. Note that these are to an -addnode peer (outbound), so we send INVs every two seconds.
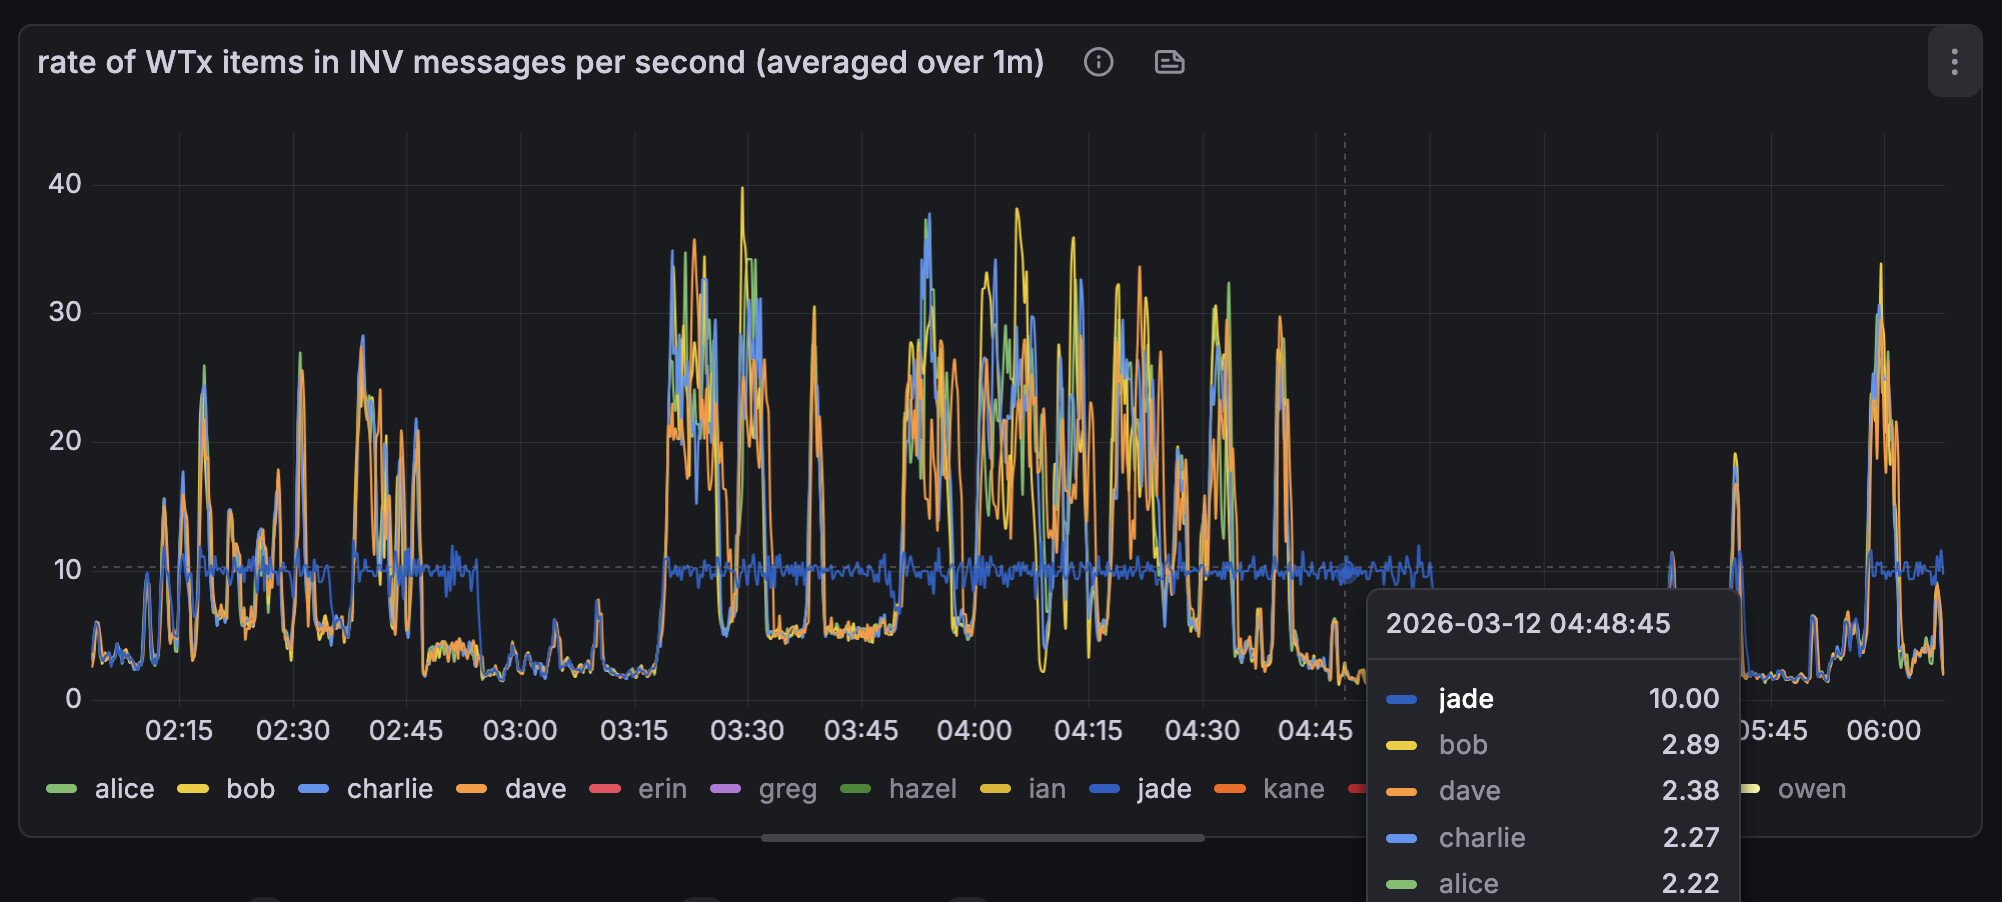
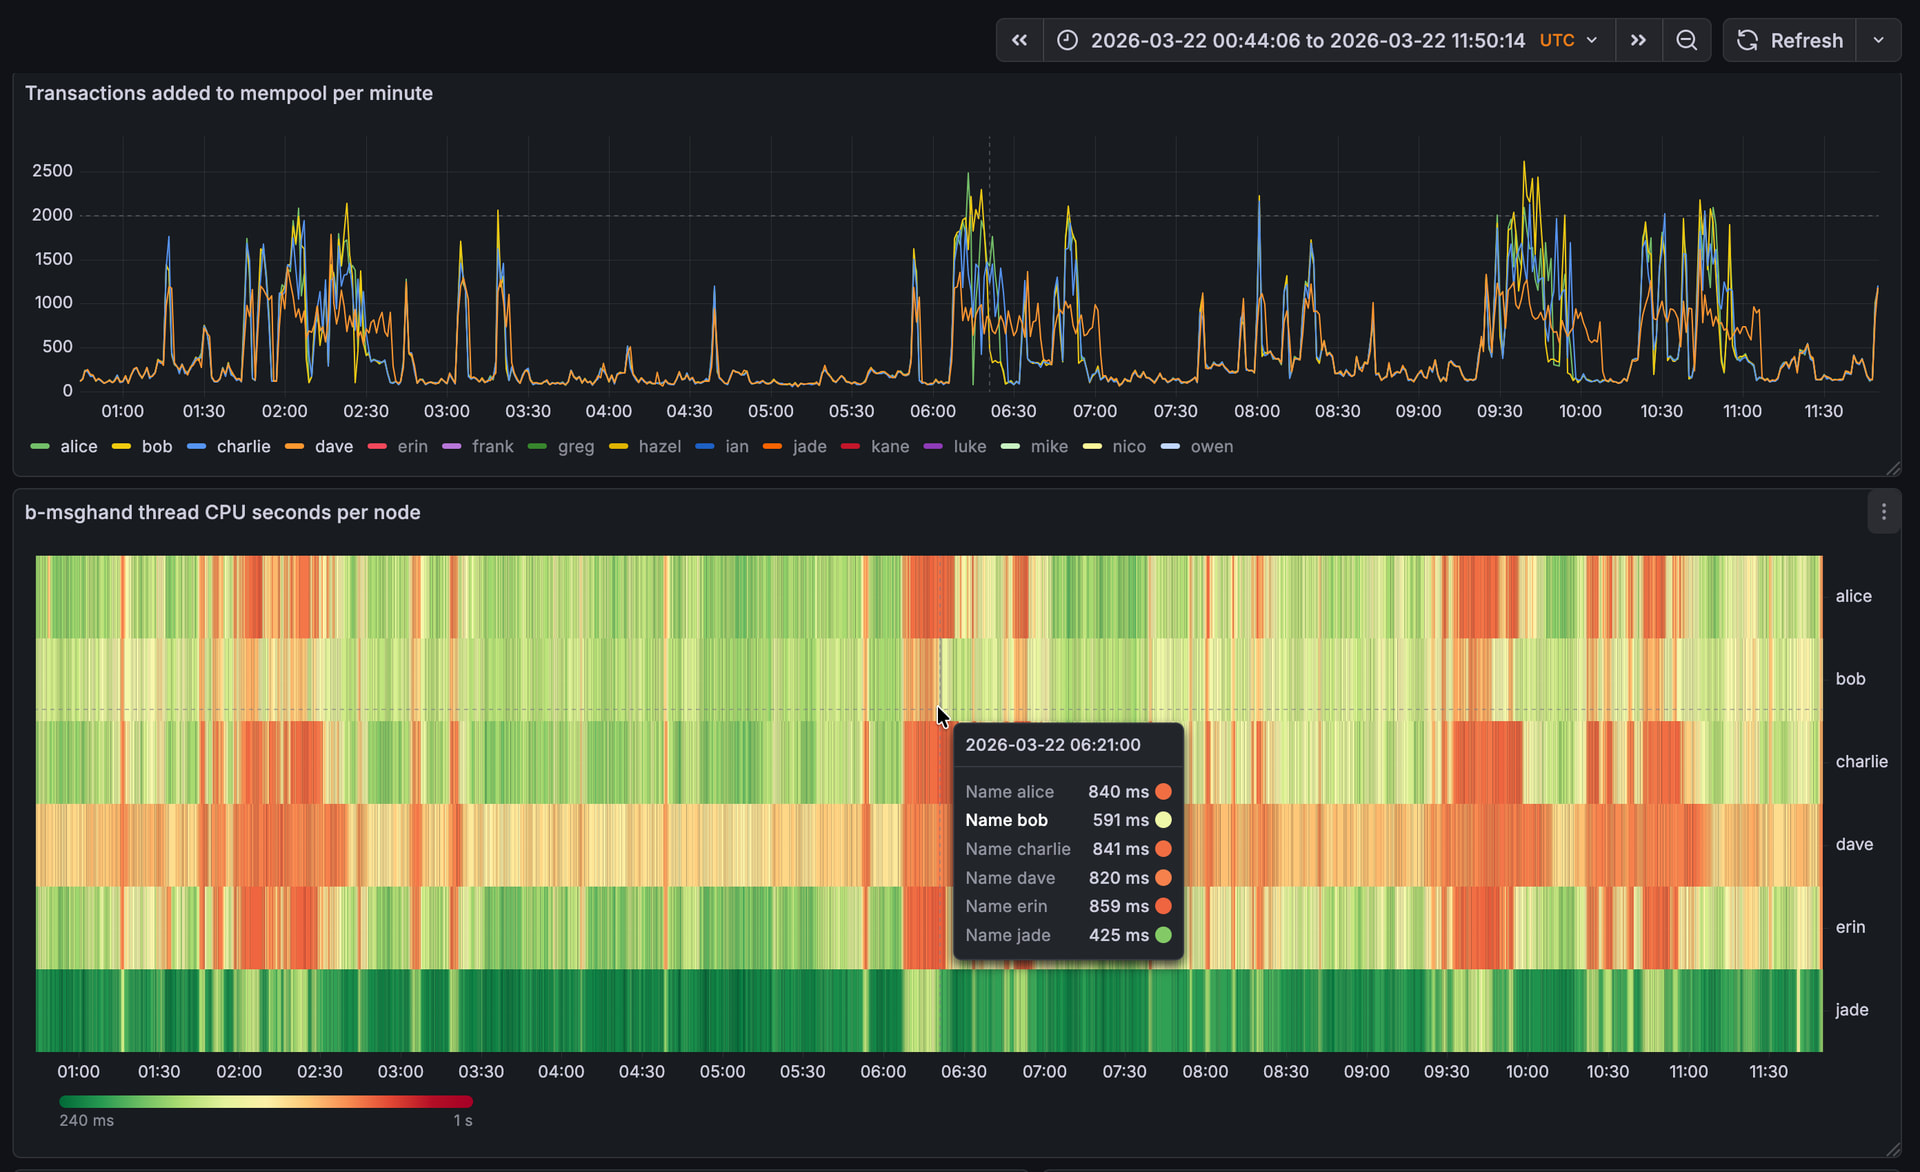
Node jade also runs the patch and is using the new -txsendrate=4 arg. During the mass broadcast, we see it announcing 10 transactions per second to the outbound addnode peer. -txsendrate is configuring the relay rate to inbound connections. As we relay to oubounds at 2.5x the rate, we’d expect 2.5 * 4 = 10, which exactly matches our expectation.
It’s visible that node jade takes a lot longer than the other nodes to process the annoucements.
Is jade also avoiding high b-msghand thread time? If so, it’s behaving as expected: 4tx/s is too slow for mainnet for inbound connections (5000tx/block is about 8 tx/s), so it’s mostly a good way of observing the backlog behaviour, rather than something sensible to run.
The ‘rate of WTx over 60s’ graph looks good to me. Interesting that the floor rose (~2tx/s between 3:10 and 3:20 vs 5tx/s between 3:40 and 3:50).
yes! Though jade also has a stronger and different CPU that the others, so the numbers aren’t directly comparable.
Looking at a recent event, now that the inbound slots on bob have filled up fully, it’s visible that the time we spend in b-msghand is mostly transaction validation, but not transaction propagation anymore. On the other nodes, we have a higher b-msghand utilization for longer, as we first do transaction validation and then the expensive transaction propagation.