Daniela Brozzoni ·
 In the past few months we saw many unreachable addresses being gossipped on the p2p network (see this thread or this one). This refers to unsolicited ADDR messages, but I wondered if we could find some more information on what’s happening by looking at nodes’ GETADDR responses instead.
I am interested to see the percentage of unreachable addresses returned by each node in a GETADDR response. This could tell us two different things:
- how much the recent address flooding may have affected the
addrmantables of otherwise well-behaved nodes. - whether unreachable addresses are being spread only through unsolicited
ADDRmessages, or also through nodes’ responses toGETADDR.
(The latter is a bit harder to see… If you see a node responding only with unreachable addresses, maybe it’s trying to spam the network, or maybe it’s simply a victim of such spam!)
For now I have a lot of data and not many conclusions. I’ll be off for a few days, so I wanted to post what I have 
First, disclaimer: I usually use virtu’s p2p-crawler to crawl the network, but it needs python 3.9 to run, and was missing some features I needed. I ended up having Claude Opus 4.8 and GPT-5.6 rewrite most of the crawler, and I have not fully reviewed the resulting code yet. Don’t trust this data too much, it might be completely off.
The crawl run took ~8 hours, starting at 19:13 UTC on 15/07/2026 and ending at 03:12 UTC on 16/07/2026. It seems that during that time the number of unique addresses in unsolicited ADDR messages dipped significantly.
For each address observed during the crawl, I recorded one of three outcomes:
- reachable: I connected and completed the Bitcoin handshake;
- unreachable: the address was valid, but I could not connect to it;
- handshake failed: I established a connection, but could not complete the Bitcoin handshake.
I reached 21,837 nodes:
| Network | Reachable | % of all reachable |
|---|---|---|
| onion_v3 | 11,170 | 51.15% |
| ipv4 | 4,626 | 21.18% |
| i2p | 4,254 | 19.48% |
| ipv6 | 1,787 | 8.18% |
I also found 671,825 unique unreachable addresses:
| Network | Unreachable | % of all unreachable |
|---|---|---|
| ipv4 | 432,682 | 64.40% |
| ipv6 | 217,373 | 32.36% |
| onion_v3 | 19,192 | 2.86% |
| i2p | 2,578 | 0.38% |
I also found 1,353 addresses where the connection succeeded but the handshake failed:
| Network | Handshake failed | % of all handshake-failed |
|---|---|---|
| ipv4 | 518 | 38.29% |
| onion_v3 | 496 | 36.66% |
| i2p | 176 | 13.01% |
| ipv6 | 163 | 12.05% |
Putting everything together:
| Network | Reachable | Unreachable | Handshake failed | Total | % unreachable | % handshake failed |
|---|---|---|---|---|---|---|
| i2p | 4,254 | 2,578 | 176 | 7,008 | 36.8% | 2.5% |
| ipv4 | 4,626 | 432,682 | 518 | 437,826 | 98.8% | 0.1% |
| ipv6 | 1,787 | 217,373 | 163 | 219,323 | 99.1% | 0.1% |
| onion_v3 | 11,170 | 19,192 | 496 | 30,858 | 62.2% | 1.6% |
I recorded the ADDR messages received after sending GETADDR to each reachable peer, and calculated the percentage of unreachable addresses in each peer response.
For this analysis, I excluded peers that returned fewer than 10 addresses, so the filtered sample contains 19,859 peers.
Percentage of unreachable addresses per getaddr response:
| % unreachable | Nodes | % of nodes |
|---|---|---|
| 0%–10% | 0 | 0.00% |
| >10%–20% | 1 | 0.01% |
| >20%–30% | 1 | 0.01% |
| >30%–40% | 8 | 0.04% |
| >40%–50% | 389 | 1.96% |
| >50%–60% | 3,998 | 20.13% |
| >60%–70% | 41 | 0.21% |
| >70%–80% | 932 | 4.69% |
| >80%–90% | 10,481 | 52.78% |
| >90%–100% | 4,008 | 20.18% |
Percentage of handshake-failed addresses per getaddr response:
| % handshake failed | Nodes | % of nodes |
|---|---|---|
| 0%–10% | 19,859 | 100.00% |
| >10%–20% | 0 | 0.00% |
| >20%–30% | 0 | 0.00% |
| >30%–40% | 0 | 0.00% |
| >40%–50% | 0 | 0.00% |
| >50%–60% | 0 | 0.00% |
| >60%–70% | 0 | 0.00% |
| >70%–80% | 0 | 0.00% |
| >80%–90% | 0 | 0.00% |
| >90%–100% | 0 | 0.00% |
This is… interesting. First of all, the majority of the spam is composed of addresses we can’t even reach, not addresses we can reach but can’t complete the handshake (I was expecting this, but wanted to double check).
And, more interestingly, the percentage of unreachable addresses in the nodes responses is alarmingly high! More than 70% of the peers in the filtered sample return >80% of unreachable addresses in their responses.
We can double check this by looking at some nodes addrmans. I looked at peer.observer’s nodes + two of my own nodes (fusillo and spaghetto[1]), and calculated the % of unreachable addresses in the new/tried table.
| Snapshot | New entries | New unreachable | New unreachable rate | Tried entries | Tried unreachable | Tried unreachable rate |
|---|---|---|---|---|---|---|
alice |
65,520 | 63,663 | 97.17% | 10,007 | 4,538 | 45.35% |
bob |
65,514 | 63,349 | 96.70% | 8,359 | 3,882 | 46.44% |
charlie |
65,516 | 63,645 | 97.14% | 10,035 | 4,548 | 45.32% |
dave |
65,526 | 57,465 | 87.70% | 12,560 | 4,605 | 36.66% |
erin |
65,512 | 57,517 | 87.80% | 12,810 | 4,704 | 36.72% |
frank |
65,513 | 63,442 | 96.84% | 8,384 | 3,858 | 46.02% |
greg |
65,522 | 63,381 | 96.73% | 7,884 | 3,791 | 48.08% |
ian |
65,523 | 63,632 | 97.11% | 11,988 | 4,681 | 39.05% |
jade |
65,516 | 57,387 | 87.59% | 13,799 | 4,770 | 34.57% |
kane |
55,576 | 25,727 | 46.29% | 10,740 | 3,236 | 30.13% |
luke |
65,515 | 63,465 | 96.87% | 11,288 | 4,599 | 40.74% |
mike |
65,205 | 63,227 | 96.97% | 11,049 | 4,631 | 41.91% |
nico |
65,530 | 62,961 | 96.08% | 9,119 | 4,426 | 48.54% |
owen |
65,515 | 63,648 | 97.15% | 7,897 | 3,930 | 49.77% |
paul |
65,507 | 63,589 | 97.07% | 2,950 | 1,669 | 56.58% |
fusillo |
65,520 | 58,868 | 89.85% | 12,059 | 4,616 | 38.28% |
spaghetto |
65,461 | 58,058 | 88.69% | 12,810 | 4,715 | 36.81% |
It appears that the new tables are full of unreachable addresses. To try and put these numbers in perspective:
- it’s normal to have unreachable addresses in our addrman - nodes come and go all the time!
- To promote an address to the tried table, we must have successfully connected to it at least once. This means that fake addresses that have never corresponded to a reachable node cannot enter the tried table. Currently, roughly 30% to 50% of the addresses in the tried table are unreachable.
Meaning, 90% of unreachable in the new table is likely higher than usual, but not catastrophic.
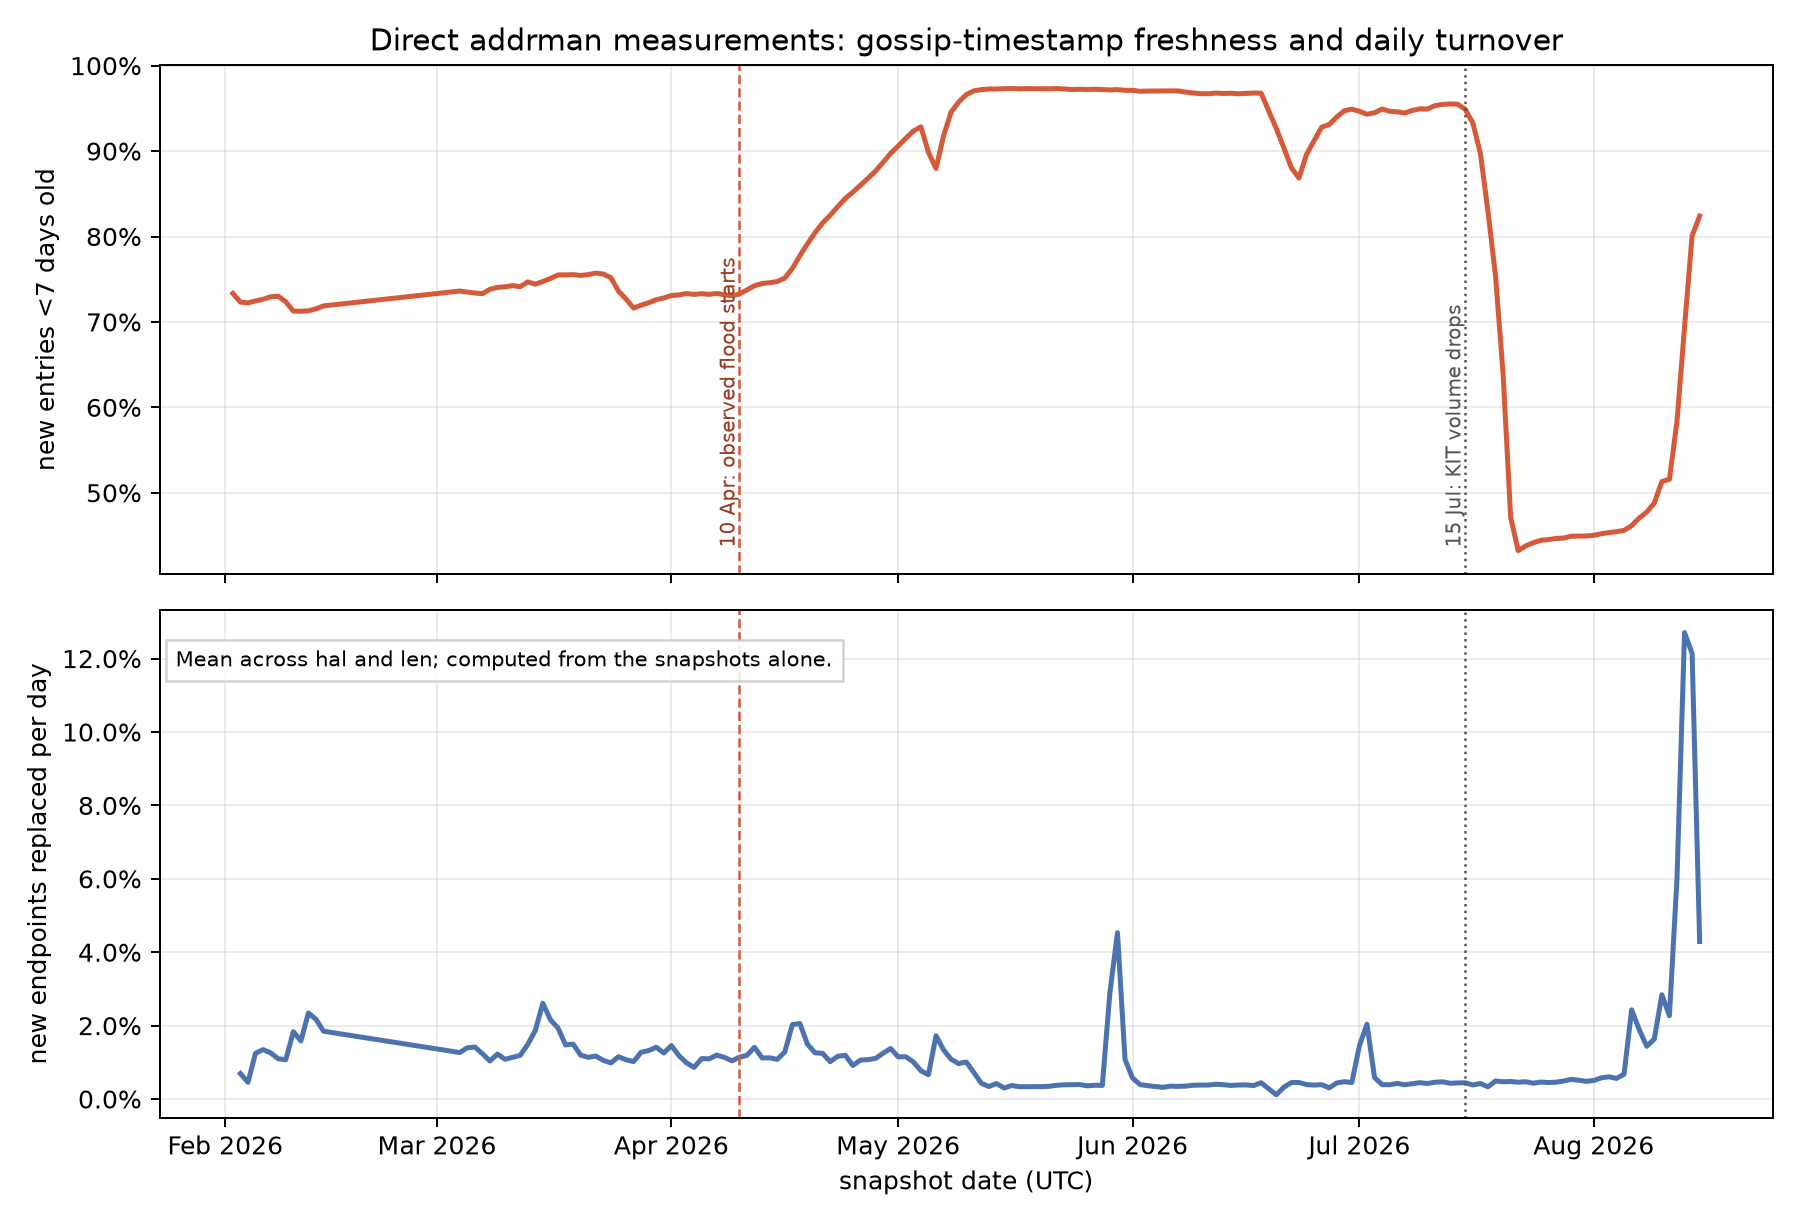
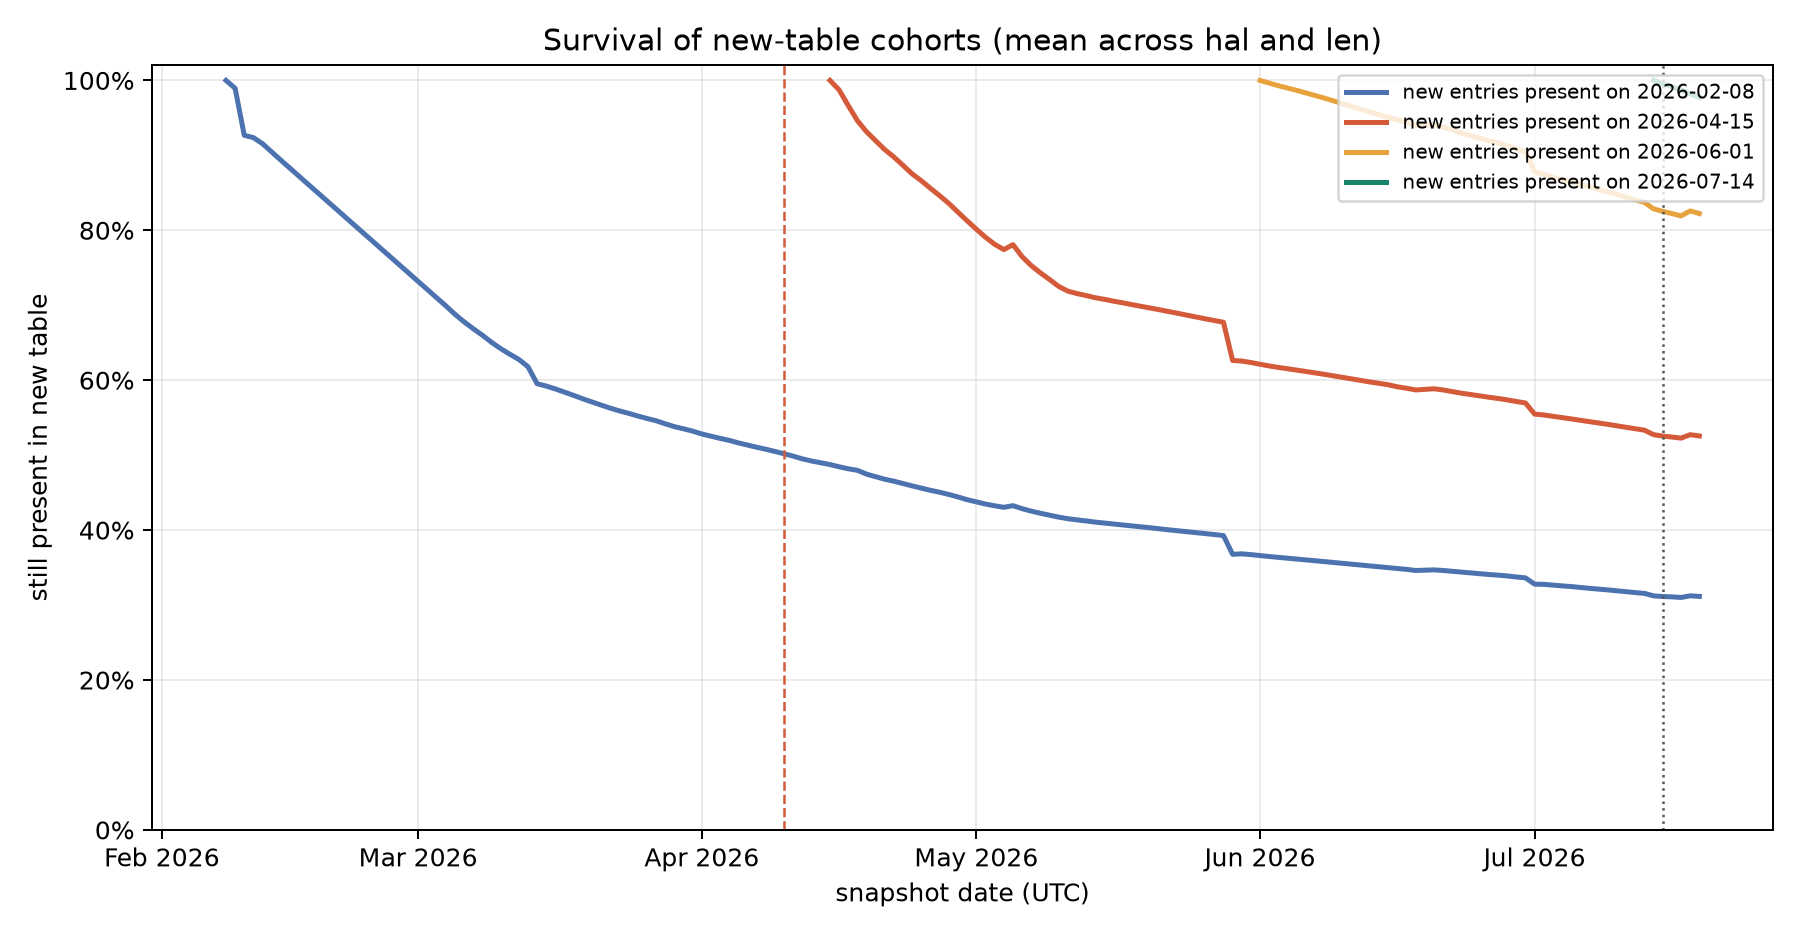
(It would be great if we could have some historic data on this!)
Lastly, I wondered: can we get some additional information by looking at the node versions in each percentage bucket? Which versions seem more affected?
I have not looked too deeply into this yet, so I have not found many particularly interesting patterns. Here is a dump of the data I have. I included every user agent with at least 50 responses across buckets, and grouped every family that wasn’t Core or Knots into an Other category.
For each user agent, I am showing the number of responses, its share of the bucket, and how common it is overall, to see whether any version is overrepresented in a particular percentage bucket.
A bunch of data
>10%–20% unreachable, 1 response:| Client family | Responses | Share of bucket | Overall share | Representation ratio |
|---|---|---|---|---|
Core:29.1.0 |
1 | 100.0% | 2.2% | 45.97x |
20–30% unreachable, 1 response:
| Client family | Responses | Share of bucket | Overall share | Representation ratio |
|---|---|---|---|---|
Core:29.0.0 |
1 | 100.0% | 3.9% | 25.62x |
30–40% unreachable, 8 responses:
| Client family | Responses | Share of bucket | Overall share | Representation ratio |
|---|---|---|---|---|
Knots:20260508 |
2 | 25.0% | 16.5% | 1.52x |
Core:29.3.0 |
1 | 12.5% | 9.1% | 1.38x |
Core:29.2.0 |
1 | 12.5% | 5.3% | 2.36x |
Knots:20260210 |
1 | 12.5% | 4.8% | 2.60x |
Core:30.2.0 |
1 | 12.5% | 4.7% | 2.67x |
Core:27.0.0 |
1 | 12.5% | 3.9% | 3.21x |
Core:31.1.0 |
1 | 12.5% | 1.5% | 8.27x |
40–50% unreachable, 389 responses:
| Client family | Responses | Share of bucket | Overall share | Representation ratio |
|---|---|---|---|---|
Core:26.0.0 |
231 | 59.4% | 4.5% | 13.22x |
Core:29.0.0 |
39 | 10.0% | 3.9% | 2.57x |
Core:29.2.0 |
30 | 7.7% | 5.3% | 1.45x |
Knots:20260508 |
18 | 4.6% | 16.5% | 0.28x |
Core:29.3.0 |
14 | 3.6% | 9.1% | 0.40x |
Core:27.1.0 |
14 | 3.6% | 2.7% | 1.32x |
Core:28.1.0 |
6 | 1.5% | 5.9% | 0.26x |
Core:31.0.0 |
5 | 1.3% | 19.0% | 0.07x |
Knots:20260210 |
4 | 1.0% | 4.8% | 0.21x |
Knots:20251110 |
4 | 1.0% | 2.0% | 0.51x |
Core:27.2.0 |
4 | 1.0% | 0.6% | 1.69x |
Core:30.2.0 |
3 | 0.8% | 4.7% | 0.16x |
Core:28.0.0 |
3 | 0.8% | 2.0% | 0.39x |
Knots:20250305 |
3 | 0.8% | 1.3% | 0.59x |
Core:30.0.0 |
2 | 0.5% | 3.0% | 0.17x |
Core:24.0.1 |
2 | 0.5% | 0.6% | 0.81x |
Core:31.1.0 |
1 | 0.3% | 1.5% | 0.17x |
Core:25.0.0 |
1 | 0.3% | 1.2% | 0.21x |
Knots:20250903 |
1 | 0.3% | 1.0% | 0.27x |
Knots:20260507 |
1 | 0.3% | 0.8% | 0.33x |
Knots:20251010 |
1 | 0.3% | 0.6% | 0.41x |
50–60% unreachable, 3,998 responses:
| Client family | Responses | Share of bucket | Overall share | Representation ratio |
|---|---|---|---|---|
Knots:20260508 |
560 | 14.0% | 16.5% | 0.85x |
Core:26.0.0 |
468 | 11.7% | 4.5% | 2.61x |
Core:31.0.0 |
430 | 10.8% | 19.0% | 0.57x |
Core:29.3.0 |
369 | 9.2% | 9.1% | 1.02x |
Core:29.0.0 |
359 | 9.0% | 3.9% | 2.30x |
Core:29.2.0 |
356 | 8.9% | 5.3% | 1.68x |
Knots:20260210 |
184 | 4.6% | 4.8% | 0.96x |
Core:30.2.0 |
172 | 4.3% | 4.7% | 0.92x |
Core:27.1.0 |
164 | 4.1% | 2.7% | 1.50x |
Core:28.1.0 |
148 | 3.7% | 5.9% | 0.62x |
Core:25.0.0 |
95 | 2.4% | 1.2% | 1.92x |
Core:29.1.0 |
89 | 2.2% | 2.2% | 1.02x |
Core:28.0.0 |
78 | 2.0% | 2.0% | 0.98x |
Core:30.0.0 |
75 | 1.9% | 3.0% | 0.62x |
Core:27.0.0 |
65 | 1.6% | 3.9% | 0.42x |
Knots:20251110 |
63 | 1.6% | 2.0% | 0.78x |
Core:31.1.0 |
58 | 1.5% | 1.5% | 0.96x |
Core:27.2.0 |
53 | 1.3% | 0.6% | 2.18x |
Core:24.0.1 |
40 | 1.0% | 0.6% | 1.58x |
Knots:20250305 |
36 | 0.9% | 1.3% | 0.69x |
Knots:20250903 |
28 | 0.7% | 1.0% | 0.74x |
Knots:20251010 |
29 | 0.7% | 0.6% | 1.16x |
Knots:20260507 |
20 | 0.5% | 0.8% | 0.65x |
Core:25.1.0 |
8 | 0.2% | 0.4% | 0.49x |
60–70% unreachable, 41 responses:
| Client family | Responses | Share of bucket | Overall share | Representation ratio |
|---|---|---|---|---|
Knots:20260508 |
13 | 31.7% | 16.5% | 1.92x |
Core:31.0.0 |
9 | 22.0% | 19.0% | 1.15x |
Core:27.0.0 |
6 | 14.6% | 3.9% | 3.75x |
Core:29.3.0 |
4 | 9.8% | 9.1% | 1.07x |
Core:26.0.0 |
4 | 9.8% | 4.5% | 2.17x |
Core:29.2.0 |
2 | 4.9% | 5.3% | 0.92x |
Knots:20260210 |
1 | 2.4% | 4.8% | 0.51x |
Core:27.2.0 |
1 | 2.4% | 0.6% | 4.00x |
70–80% unreachable, 932 responses:
| Client family | Responses | Share of bucket | Overall share | Representation ratio |
|---|---|---|---|---|
Core:27.0.0 |
357 | 38.3% | 3.9% | 9.83x |
Knots:20260508 |
250 | 26.8% | 16.5% | 1.63x |
Core:31.0.0 |
178 | 19.1% | 19.0% | 1.00x |
Core:29.2.0 |
25 | 2.7% | 5.3% | 0.51x |
Core:30.2.0 |
24 | 2.6% | 4.7% | 0.55x |
Core:30.0.0 |
21 | 2.3% | 3.0% | 0.74x |
Knots:20260210 |
12 | 1.3% | 4.8% | 0.27x |
Core:29.1.0 |
8 | 0.9% | 2.2% | 0.39x |
Core:28.1.0 |
7 | 0.8% | 5.9% | 0.13x |
Core:28.0.0 |
6 | 0.6% | 2.0% | 0.32x |
Knots:20251110 |
6 | 0.6% | 2.0% | 0.32x |
Knots:20260507 |
6 | 0.6% | 0.8% | 0.84x |
Core:29.3.0 |
5 | 0.5% | 9.1% | 0.06x |
Knots:20251010 |
5 | 0.5% | 0.6% | 0.86x |
Core:29.0.0 |
4 | 0.4% | 3.9% | 0.11x |
Knots:20250305 |
3 | 0.3% | 1.3% | 0.24x |
Core:26.0.0 |
2 | 0.2% | 4.5% | 0.05x |
Core:31.1.0 |
1 | 0.1% | 1.5% | 0.07x |
Knots:20250903 |
2 | 0.2% | 1.0% | 0.23x |
Core:27.2.0 |
2 | 0.2% | 0.6% | 0.35x |
| Other | 2 | 0.2% | 0.2% | 1.25x |
Core:27.1.0 |
1 | 0.1% | 2.7% | 0.04x |
Core:25.0.0 |
1 | 0.1% | 1.2% | 0.09x |
80–90% unreachable, 10,481 responses:
| Client family | Responses | Share of bucket | Overall share | Representation ratio |
|---|---|---|---|---|
Core:31.0.0 |
2,404 | 22.9% | 19.0% | 1.21x |
Knots:20260508 |
2,002 | 19.1% | 16.5% | 1.16x |
Core:29.3.0 |
1,273 | 12.1% | 9.1% | 1.34x |
Knots:20260210 |
635 | 6.1% | 4.8% | 1.26x |
Core:29.2.0 |
583 | 5.6% | 5.3% | 1.05x |
Core:28.1.0 |
502 | 4.8% | 5.9% | 0.81x |
Core:30.2.0 |
420 | 4.0% | 4.7% | 0.86x |
Core:30.0.0 |
357 | 3.4% | 3.0% | 1.12x |
Core:27.1.0 |
286 | 2.7% | 2.7% | 1.00x |
Knots:20251110 |
245 | 2.3% | 2.0% | 1.16x |
Core:29.1.0 |
231 | 2.2% | 2.2% | 1.01x |
Core:29.0.0 |
223 | 2.1% | 3.9% | 0.55x |
Core:28.0.0 |
206 | 2.0% | 2.0% | 0.99x |
Knots:20250305 |
180 | 1.7% | 1.3% | 1.31x |
Core:27.0.0 |
155 | 1.5% | 3.9% | 0.38x |
Knots:20250903 |
128 | 1.2% | 1.0% | 1.28x |
Core:26.0.0 |
101 | 1.0% | 4.5% | 0.21x |
Core:31.1.0 |
98 | 0.9% | 1.5% | 0.62x |
Knots:20260507 |
96 | 0.9% | 0.8% | 1.19x |
Knots:20251010 |
78 | 0.7% | 0.6% | 1.19x |
Core:25.0.0 |
61 | 0.6% | 1.2% | 0.47x |
Core:27.2.0 |
46 | 0.4% | 0.6% | 0.72x |
Core:24.0.1 |
28 | 0.3% | 0.6% | 0.42x |
Core:25.1.0 |
11 | 0.1% | 0.4% | 0.26x |
| Other | 10 | 0.1% | 0.2% | 0.56x |
90–100% unreachable, 4,008 responses:
| Client family | Responses | Share of bucket | Overall share | Representation ratio |
|---|---|---|---|---|
Core:31.0.0 |
753 | 18.8% | 19.0% | 0.99x |
Core:28.1.0 |
516 | 12.9% | 5.9% | 2.17x |
Knots:20260508 |
432 | 10.8% | 16.5% | 0.65x |
Core:30.2.0 |
310 | 7.7% | 4.7% | 1.65x |
Core:27.0.0 |
190 | 4.7% | 3.9% | 1.22x |
Core:29.0.0 |
149 | 3.7% | 3.9% | 0.95x |
Core:30.0.0 |
147 | 3.7% | 3.0% | 1.21x |
Core:29.3.0 |
139 | 3.5% | 9.1% | 0.38x |
Core:31.1.0 |
141 | 3.5% | 1.5% | 2.33x |
Knots:20260210 |
118 | 2.9% | 4.8% | 0.61x |
Core:29.1.0 |
103 | 2.6% | 2.2% | 1.18x |
Core:28.0.0 |
101 | 2.5% | 2.0% | 1.27x |
Core:25.0.0 |
88 | 2.2% | 1.2% | 1.77x |
Core:26.0.0 |
86 | 2.1% | 4.5% | 0.48x |
Knots:20251110 |
82 | 2.0% | 2.0% | 1.02x |
Core:27.1.0 |
77 | 1.9% | 2.7% | 0.70x |
Core:25.1.0 |
62 | 1.5% | 0.4% | 3.79x |
Core:29.2.0 |
56 | 1.4% | 5.3% | 0.26x |
Core:24.0.1 |
56 | 1.4% | 0.6% | 2.20x |
Knots:20250305 |
39 | 1.0% | 1.3% | 0.74x |
Knots:20250903 |
30 | 0.7% | 1.0% | 0.79x |
Knots:20260507 |
30 | 0.7% | 0.8% | 0.97x |
| Other | 22 | 0.5% | 0.2% | 3.21x |
Core:27.2.0 |
15 | 0.4% | 0.6% | 0.61x |
Knots:20251010 |
11 | 0.3% | 0.6% | 0.44x |
I noticed that the “Other” category is overrepresented in the >90-100% bucket. Here’s the raw data with IPs hidden, since it’s only 22 responses:
| Node | Percentage of unreachable | Network | Version | Services | User agent |
|---|---|---|---|---|---|
| 1 | 90.90% | IPv4 | 70016 | NODE_BLOOM, NODE_WITNESS, NODE_NETWORK_LIMITED |
/btcwire:0.5.0/btcd:0.25.0/ |
| 2 | 91.80% | IPv4 | 70016 | NODE_BLOOM, NODE_WITNESS, NODE_NETWORK_LIMITED |
/btcwire:0.5.0/btcd:0.25.0/ |
| 3 | 90.80% | IPv4 | 70016 | NODE_BLOOM, NODE_WITNESS, NODE_NETWORK_LIMITED |
/btcwire:0.5.0/btcd:0.25.0/ |
| 4 | 93.91% | IPv4 | 70016 | NODE_WITNESS, NODE_NETWORK_LIMITED, NODE_P2P_V2 |
/CKCoinD:31.0.0/ |
| 5 | 91.90% | IPv6 | 70016 | NODE_NETWORK, NODE_BLOOM, NODE_WITNESS, NODE_NETWORK_LIMITED, NODE_P2P_V2, bit12 (0x1000), bit13 (0x2000) |
/btcwire:0.5.0/utreexod:0.5.1/ |
| 6 | 94.40% | IPv6 | 70016 | NODE_BLOOM, NODE_WITNESS, NODE_NETWORK_LIMITED |
/btcwire:0.5.0/btcd:0.25.0/ |
| 7 | 95.30% | IPv4 | 70016 | NODE_WITNESS, NODE_NETWORK_LIMITED, NODE_P2P_V2, bit12 (0x1000) |
/Ghost:1.10.22/ |
| 8 | 94.41% | IPv6 | 70016 | NODE_WITNESS, NODE_NETWORK_LIMITED, NODE_P2P_V2 |
/CKCoinD:31.0.0/ |
| 9 | 95.40% | IPv6 | 70016 | NODE_WITNESS, NODE_NETWORK_LIMITED, NODE_P2P_V2, bit12 (0x1000) |
/Ghost:1.10.22/ |
| 10 | 94.20% | IPv6 | 70016 | NODE_WITNESS, NODE_NETWORK_LIMITED, NODE_P2P_V2, bit12 (0x1000) |
/Ghost:1.10.22/ |
| 11 | 93.80% | IPv6 | 70016 | NODE_WITNESS, NODE_NETWORK_LIMITED, NODE_P2P_V2, bit12 (0x1000) |
/Ghost:1.10.22/ |
| 12 | 96.40% | IPv6 | 70016 | NODE_WITNESS, NODE_NETWORK_LIMITED, NODE_P2P_V2, bit12 (0x1000) |
/Ghost:1.10.22/ |
| 13 | 96.40% | IPv6 | 70016 | NODE_WITNESS, NODE_NETWORK_LIMITED, NODE_P2P_V2, bit12 (0x1000) |
/Ghost:1.10.22/ |
| 14 | 97.20% | IPv6 | 70016 | NODE_WITNESS, NODE_NETWORK_LIMITED, NODE_P2P_V2, bit12 (0x1000) |
/Ghost:1.10.22/ |
| 15 | 91.80% | IPv4 | 70016 | NODE_NETWORK, NODE_BLOOM, NODE_WITNESS, NODE_NETWORK_LIMITED, NODE_P2P_V2, bit12 (0x1000), bit13 (0x2000) |
/btcwire:0.5.0/utreexod:0.5.1/ |
| 16 | 94.21% | IPv4 | 70016 | NODE_WITNESS, NODE_NETWORK_LIMITED, NODE_P2P_V2 |
/CKCoinD:31.0.0/ |
| 17 | 96.70% | IPv4 | 70016 | NODE_WITNESS, NODE_NETWORK_LIMITED, NODE_P2P_V2, bit12 (0x1000) |
/Ghost:1.10.22/ |
| 18 | 95.80% | IPv4 | 70016 | NODE_WITNESS, NODE_NETWORK_LIMITED, NODE_P2P_V2 |
/CKCoinD:31.0.0/ |
| 19 | 94.61% | IPv4 | 70016 | NODE_WITNESS, NODE_NETWORK_LIMITED, NODE_P2P_V2 |
/CKCoinD:31.0.0/ |
| 20 | 95.90% | IPv4 | 70016 | NODE_NETWORK, NODE_WITNESS, NODE_NETWORK_LIMITED, NODE_P2P_V2 |
/Satoshi-Noderunners:31.0.0/ |
| 21 | 94.81% | IPv4 | 70012 | NODE_NETWORK, NODE_BLOOM, NODE_XTHIN |
/Classic:1.2.0(EB3.7)/ |
| 22 | 95.70% | IPv4 | 70016 | NODE_WITNESS, NODE_NETWORK_LIMITED, NODE_P2P_V2, bit12 (0x1000) |
/Ghost:1.10.22/ |
And that’s it! I would love it if someone tried to reproduce all of this - I’m not very confident in the data I found, and I’m sure a few bugs slipped in somewhere
Yes, I named my nodes after Italian pasta. I am very pleased with myself. ↩︎
 Strakeljahn ·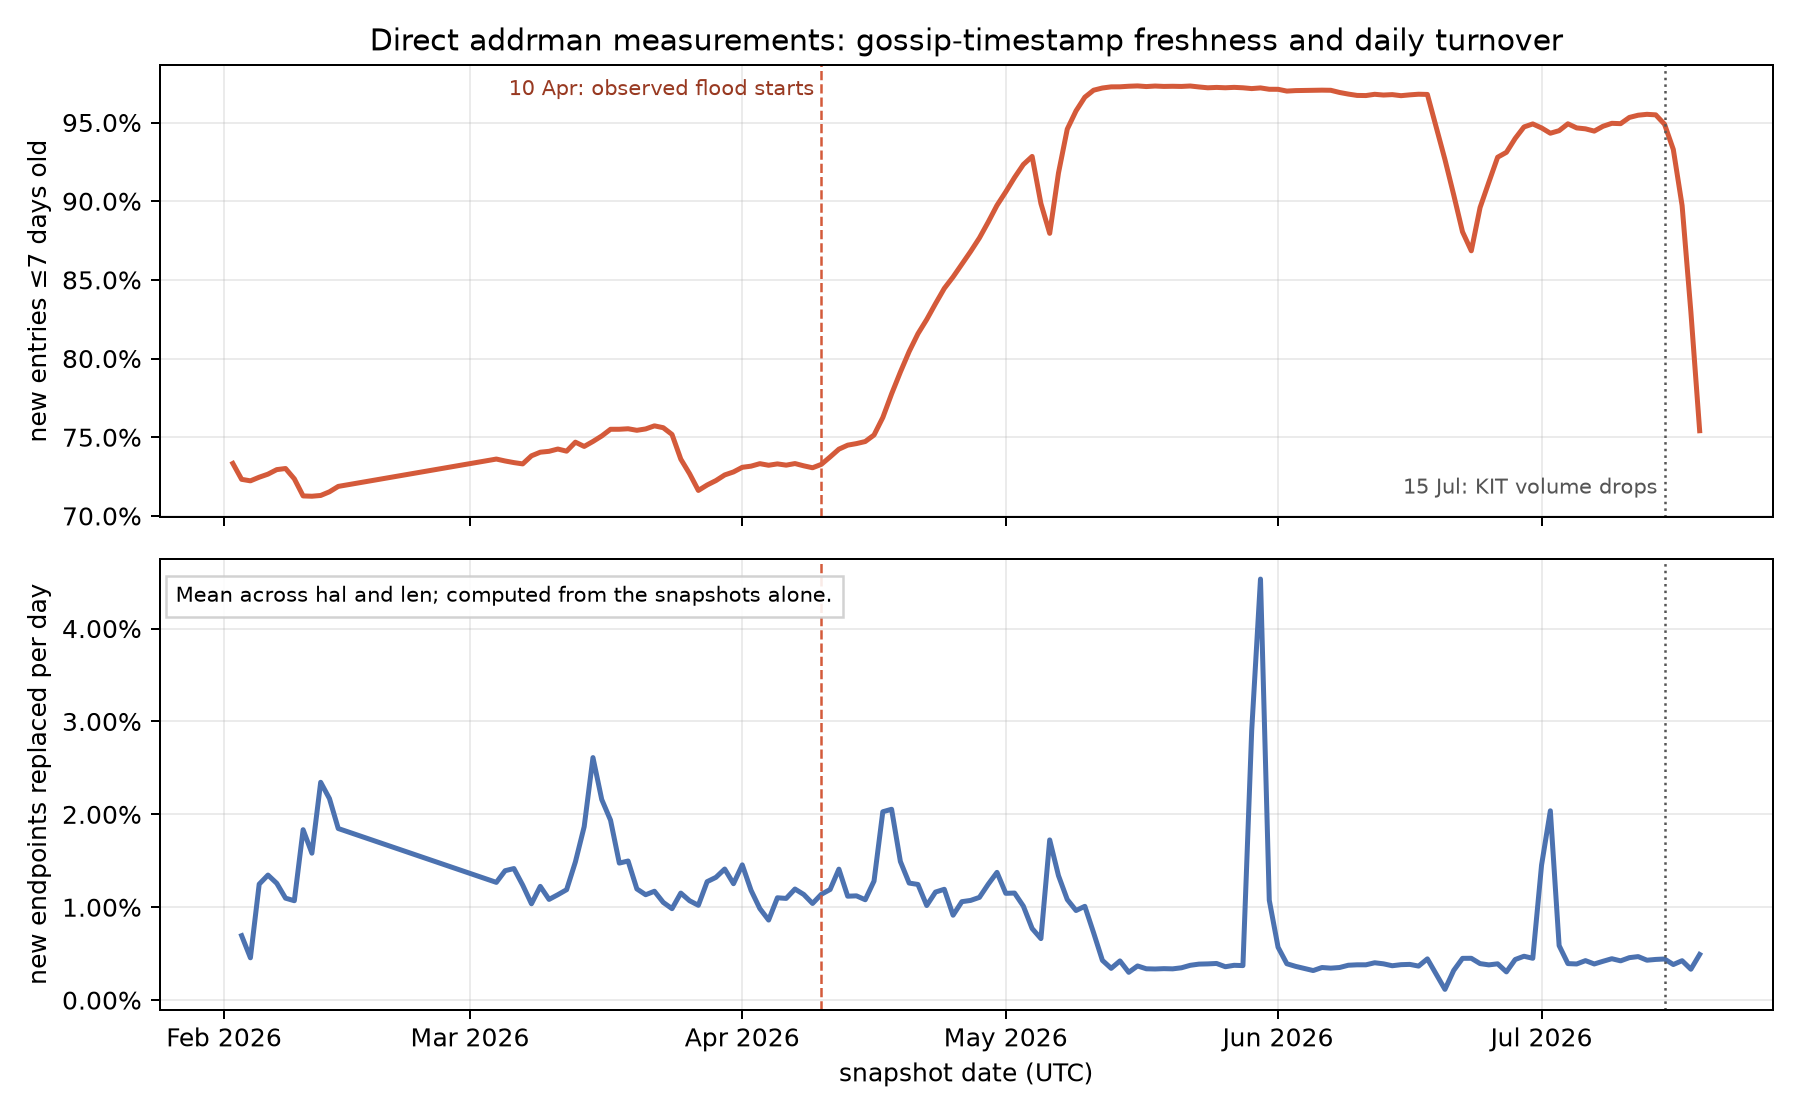
 b10c ·